

部署运维
基础设施

sandbase-harness
sandbaseai
Local-first, self-hosted AI agent runtime and MCP bridge with sandboxed sessions, memory, credentials, audit/replay, and a local Console.
PROJECT TOPICS
INSTALL REFERENCE
dsh plugin --profile web add github:yokesky/dsh-usage-lens
该命令指向仓库当前默认分支;尚无绑定当前 commit 的完整验证结果。
PROJECT README


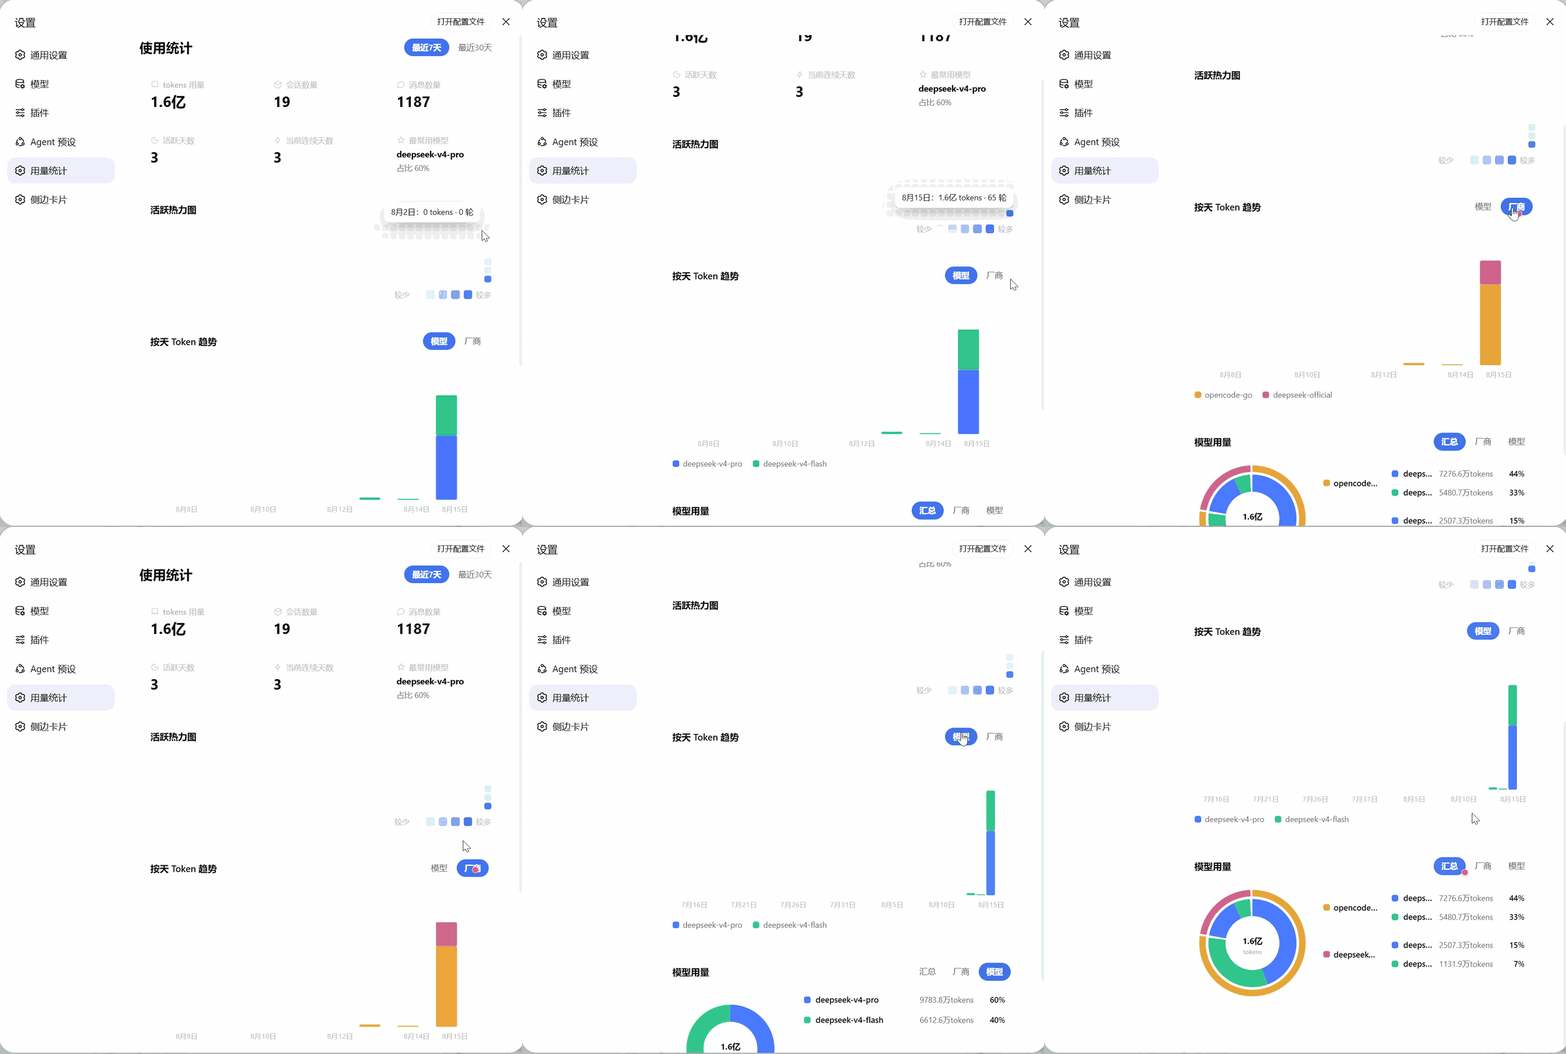
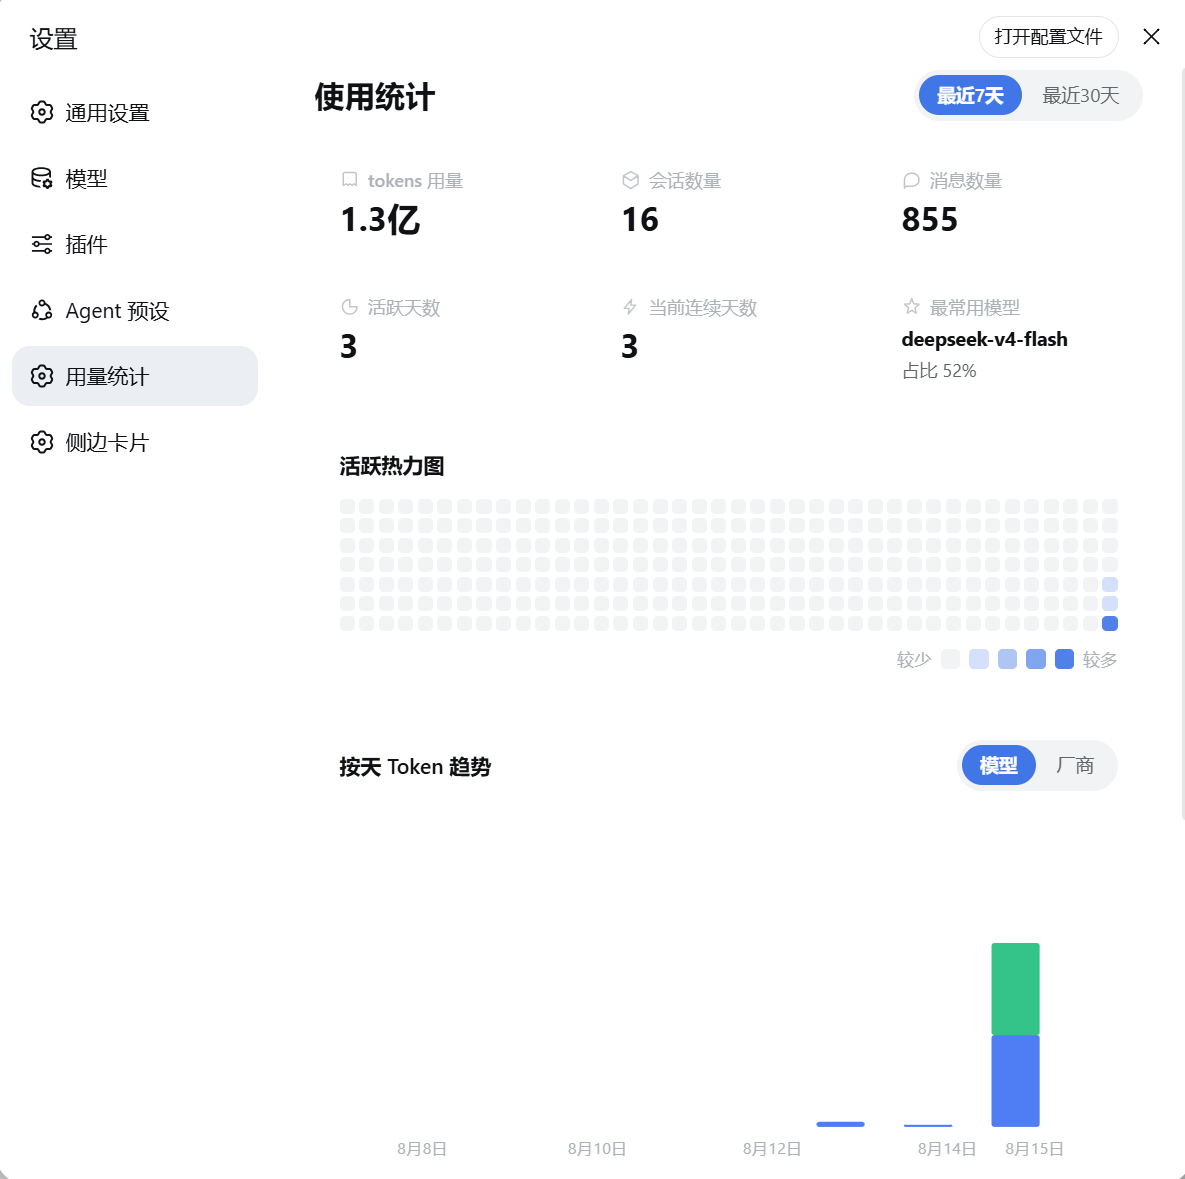
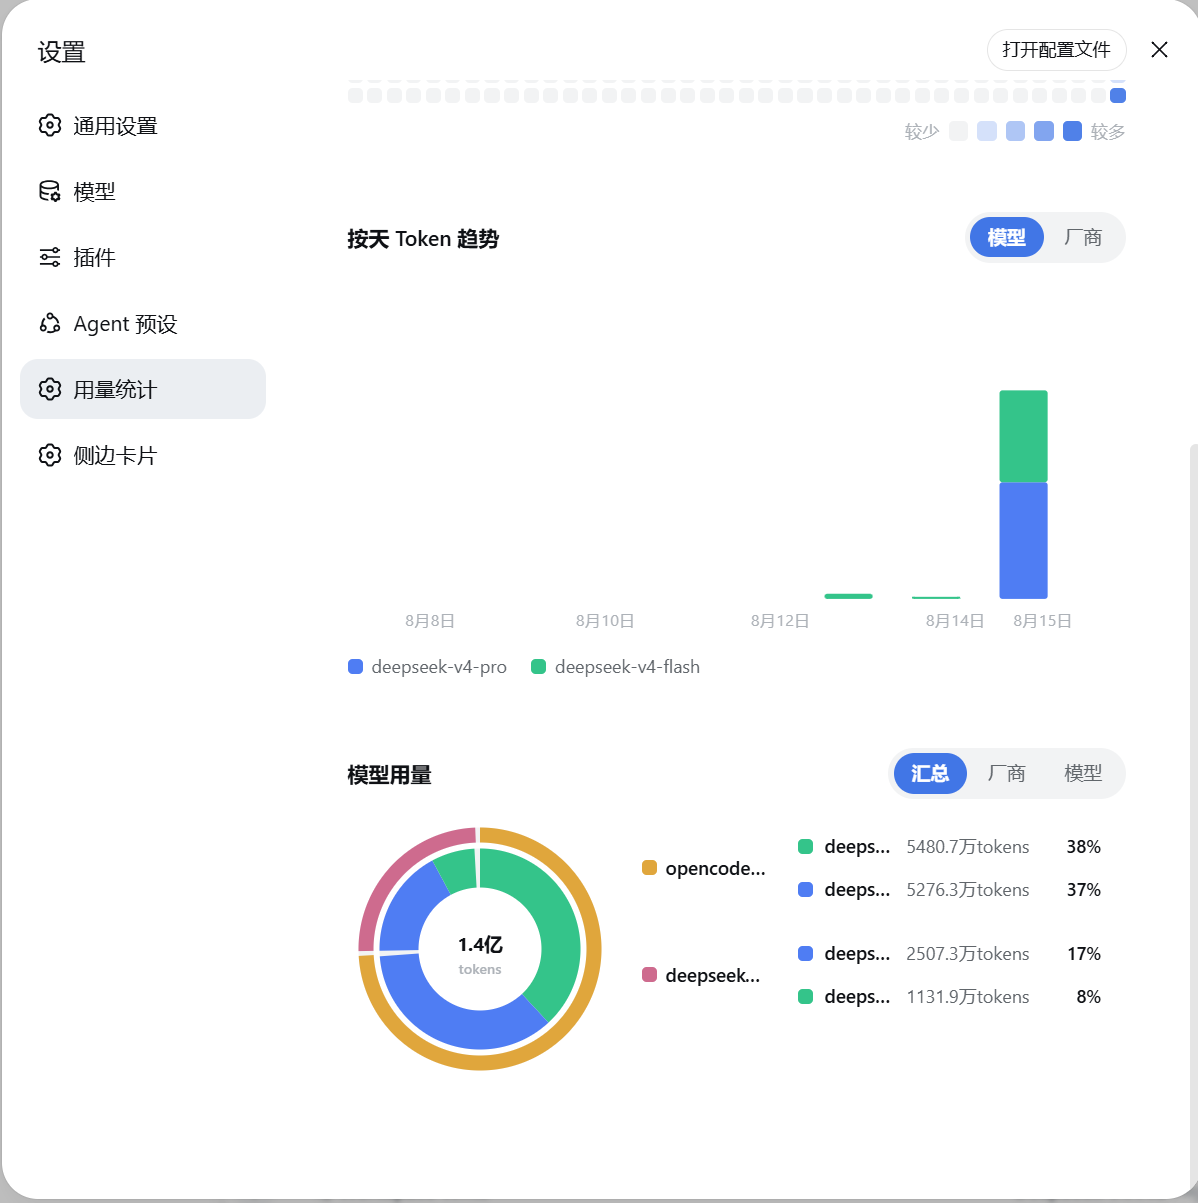
DeepSeek Harness(DSH)Web UI 的用量统计面板,风格参考作者喜欢的 ZCode Harness 设计。 安装后,设置面板会新增「用量统计」页面,直观展示你的使用情况。
npm install -g @deepseek-ai/dsh   # 先安装 dsh CLI,然后才能执行 dsh 命令
dsh plugin --profile web add @yokesky/dsh-usage-lens# 需要已安装 dsh CLI(npm install -g @deepseek-ai/dsh),如已装可跳过
git clone https://github.com/yokesky/dsh-usage-lens.git
cd dsh-usage-lens
pnpm install
pnpm build
dsh plugin --profile web add link:<本仓库绝对路径>说明:
link:方式指向本地源码,修改代码后重新pnpm build并重启 web 服务即可生效,无需重新安装。也可以直接从本仓库路径安装:dsh plugin --profile web add <本仓库路径>。
重启 web 服务,打开设置面板即可看到「用量统计」。
A usage statistics dashboard for the DeepSeek Harness (DSH) Web UI. Once installed, a new Usage Statistics page appears in Settings.
Features: overview cards (tokens, sessions, messages, active days, current streak, top model), a 280-day GitHub-style activity heatmap, a daily token trend chart with model/provider views, and a model-usage donut chart with summary/provider/model modes.
Install:
npm install -g @deepseek-ai/dsh
dsh plugin --profile web add @yokesky/dsh-usage-lens
Restart the web service, then open Settings → Usage Statistics.
All data is read from your local DSH session logs and processed locally — nothing is uploaded. The panel follows DSH's light / dark theme automatically.
MIT © 2026 yokesky
CLASSIFICATION EVIDENCE
系统优先读取 GitHub Topics,再与站内分类词典和词根规则比对。当前命中: token-usage、usage-statistics。
sandbaseai
Local-first, self-hosted AI agent runtime and MCP bridge with sandboxed sessions, memory, credentials, audit/replay, and a local Console.

Han-1413141
Cost tracking for DeepSeek Harness: session and model costs, token usage, budgets, provider balances, and coding-plan quotas. Bilingual English/Chinese UI.

wssfk12138
DeepSeek Harness Token 余额监控插件:鲸鱼娘待机/扣费/复苏动画、峰谷计费、连续扣费飘字与会话费用统计。