部署运维
基础设施

sandbase-harness
sandbaseai
Local-first, self-hosted AI agent runtime and MCP bridge with sandboxed sessions, memory, credentials, audit/replay, and a local Console.

janpauldahlke/dsh-gpu-monitor-nvml
DeepSeek Harness (dsh) plugin: live NVIDIA GPU monitor in the web rightbar. NVML-first on Linux (nvidia-smi fallback). NVIDIA only! Not AMD/Intel/macOS. Multi-GPU util/VRAM/power/temp, processes, sparklines. Installable dsh.bundle.
PROJECT TOPICS
INSTALL REFERENCE
dsh plugin --profile web add github:janpauldahlke/dsh-gpu-monitor-nvml
该命令指向仓库当前默认分支;尚无绑定当前 commit 的完整验证结果。
PROJECT README
A real-time multi-GPU monitor pane for the DeepSeek Harness web UI. One tab in the right sidebar, one second per sample, every metric named — so a fleet of GPUs reads as clearly as a dashboard instead of a raw dump.
Built and verified against live hardware: an NVIDIA RTX 4080 SUPER (index 0) and an NVIDIA RTX A4000 (index 1), both visible in the pane simultaneously.
dsh web).| Platform | Metrics | Notes |
|---|---|---|
| Linux | NVML (primary), nvidia-smi fallback |
Fully supported |
| Windows | nvidia-smi (primary today) |
node-nvml ships Linux binaries only; NVML used automatically if a Windows binding appears. Community testers welcome. |
| macOS | Stub only | No NVIDIA on modern Macs — not a real monitor target |
Light theme, matching the DSH default.
| Pane open | Dock chip (pane closed) |
|---|---|
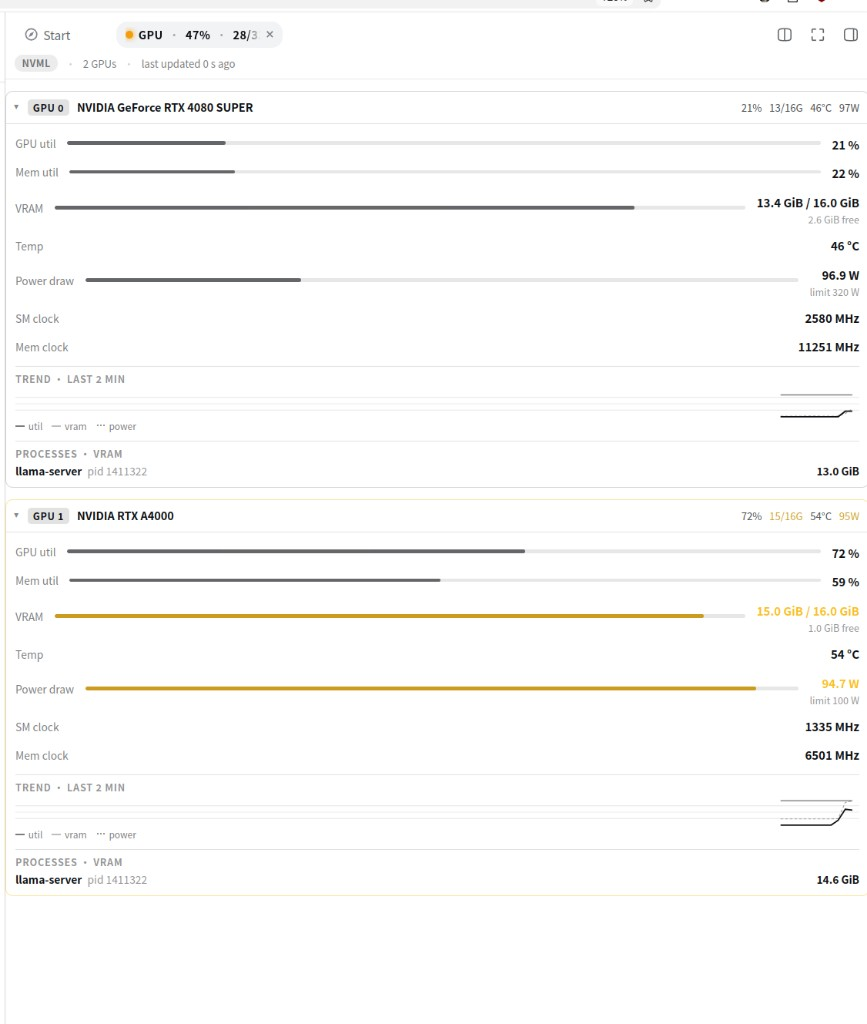 |
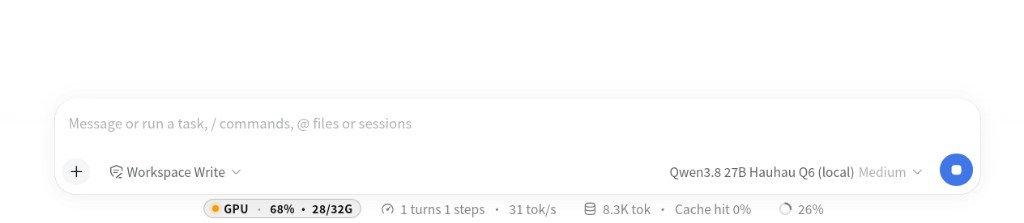 |
| Collapsed cards |
|---|
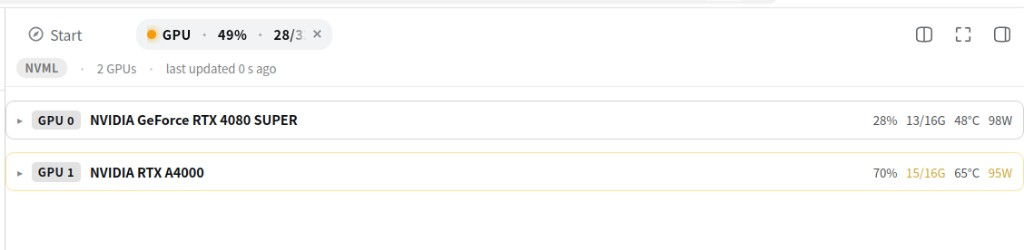 |
If images fail to load, the ASCII mock below still conveys the layout.
GPU Monitor  [NVML]   updated 1 s ago

GPU 0 · NVIDIA RTX 4080 SUPER
  GPU util      62 %      ▓▓▓▓▓▓▓▓░░
  Mem util      35 %      ▓▓▓▓░░░░░░
  VRAM          9.7 / 16 GiB   free 5.4 GiB   ▓▓▓▓▓▓▓▓▓░
  Power draw    261 W   limit 320 W   ▓▓▓▓▓▓▓░░░
  SM clock      2460 MHz   Mem clock 1313 MHz
  ── Trend · last 2 min ──
  ┌─────────────────────────────────┐
  │   util ───  vram ──  power ┈┈   │   3 series, 120 pts @ 1 Hz
  └─────────────────────────────────┘
  Processes · VRAM
    llama-server  pid 1113321   9.4 GiB

GPU 1 · NVIDIA RTX A4000
...title): what the metric is and where it comes from,
including the NVML-vs-smi "used" semantics (see Data honesty below).no-store, a source badge (NVML / smi),
"updated N s ago" in the fleet header, and per-GPU error notes. Stale data is marked
stale, never smoothed into a lie.The primary source on Linux is NVML via node-nvml, driven with raw C-FFI (a js-proxy
mangling of zero-arg out-pointer calls forced us to the raw API). Every field is sampled
in isolation: one failing metric reads as "no data" for that row, it never blanks the
GPU, and sampleFleet() never throws.
Two semantics worth knowing, both explained in tooltips:
memoryUsedMiB is total − free, which
includes the driver/context reservation (~400–430 MiB on this hardware), so NVML reads
higher than nvidia-smi's process-based column. That is intentional; memoryFreeMiB
is exposed alongside for clarity.nvidia-smi and the pane shows an smi badge so you always know which source you're
looking at. On Windows this is the expected path today.This is a dual-face plugin package: one npm package, two runtimes.
lib/index.js, ESM) — registers the plugin, owns a 1 s sampling loop
(SAMPLE_INTERVAL_MS = 1000), and serves a JSON snapshot at
GET /api/dsh-gpu-monitor on the same origin as the page.lib/client.js, CJS closure factory) — loaded by the web client via
window.__ModuleLoader__.load({ id, factory }). Self-chaining 1 Hz fetch (no-store,
abortable), renders the pane into the right-sidebar tab slot, and keeps a per-GPU
rolling history buffer (capped at 120 points) that feeds the sparklines.cordis.patch.yml inserts one Loader row for the dual-face package; the
browser half is discovered from the dsh.client declaration in package.json.Client constraints, honored: only frozen PLATFORM_MODULES may be required at runtime
(react, cordis, client store, ui slots/primitives/dockkit); everything else is inlined by
esbuild. Presentation is inline styles only — no CSS files in the bundle.
dsh-gpu-monitor-nvml/
├── package.json          # dual-face exports: "." (host) and "./client" (browser)
├── build.mjs             # esbuild, two configs (host ESM + client CJS closure factory)
├── cordis.patch.yml      # Loader row
├── media/                # README screenshots
├── src/
│   ├── host/
│   │   ├── index.ts      # plugin registration + sampling loop
│   │   ├── route.ts      # the exact route the client polls
│   │   ├── collect.ts    # NVML sampler (raw C-FFI, per-field isolation)
│   │   └── collect-smi.ts# labeled degraded fallback (Windows PATH / .exe)
│   ├── client/
│   │   ├── index.tsx     # slot injection
│   │   ├── GpuBody.tsx   # the pane: rows, meters, sparklines, history
│   │   └── GpuTitle.tsx  # tab chip
│   └── shared/
│       └── types.ts      # GpuSample / GpuFleetSnapshot / GpuProcess / round1
└── lib/ # prebuilt output (committed for install-without-toolchain)Requires DeepSeek Harness with a web profile and an NVIDIA driver
(nvidia-smi on PATH at minimum; NVML on Linux via node-nvml).
dsh plugin --profile web add dsh-gpu-monitor-nvml
# restart dsh web (or rely on live patch reload), then hard-refresh the browserdsh plugin --profile web add github:janpauldahlke/dsh-gpu-monitor-nvmllib/ is committed, so install does not require a local TypeScript/esbuild toolchain.
git clone https://github.com/janpauldahlke/dsh-gpu-monitor-nvml.git
cd dsh-gpu-monitor-nvml
npm install          # pulls node-nvml; prepare builds lib/ if toolchain present
node build.mjs       # optional: force rebuild → lib/index.js + lib/client.js

# wire into your web profile (absolute path; link: dep + bundle entry)
dsh plugin --profile web add "$PWD"
That updates ~/.dsh/profiles/web/package.json roughly to:
"dependencies": {
  "dsh-gpu-monitor-nvml": "link:/abs/path/to/dsh-gpu-monitor-nvml"
},
"dsh": {
  "profile": {
    "bundles": [
      "@deepseek-ai/dsh-base",
      "@deepseek-ai/dsh-web-app",
      "dsh-gpu-monitor-nvml"
    ]
  }
}
Restart dsh web, hard-refresh. The rightbar GPU tab and footer dock chip
should appear.
# edit src/ → rebuild (profile already link:s this tree)
node build.mjs
# host half often hot-reloads with patchReload: live; client half: hard-refresh
If the profile cannot resolve the package name:
ln -sfn "$PWD" "$HOME/.dsh/profiles/web/node_modules/dsh-gpu-monitor-nvml"Do not link only into a harness monorepo node_modules — Cordis resolves from
the profile.
dsh --profile web --dump-config | grep -E 'gpu-monitor|dsh-gpu-monitor-nvml'
curl -s http://127.0.0.1:3080/api/dsh-gpu-monitor | head   # adjust port
# expect JSON: ok, source ("nvml"|"smi"), gpus[]
Remove:
dsh plugin --profile web remove dsh-gpu-monitor-nvmlNot a one-shot codegen demo. Roughly a day of closed-loop iteration on live
hardware: research the DSH plugin contract, scaffold, hit NVML through raw C-FFI,
break things, fix them, polish the pane (named metrics, meters, sparklines), and
re-check every pass on a dedicated acceptance port — without touching sacred
ports (:3080 main dsh, :8080 llama-server, :11434 ollama). The result is
small, depends only on node-nvml at runtime, and labels where every number
came from.
Built as a human ↔ local-model pair, not “AI did it” and not “human only reviewed.”
-ts 1,1) across the same two cards this plugin monitors —
RTX 4080 SUPER + RTX A4000. In the pane, llama-server is the coauthor
thinking.The interesting part is the recursion: an agent helping build a monitor for the GPUs it is running on, with a human in the loop the whole way, not as a spectator, as the other half of the pair.
License: MIT · Contributing
CLASSIFICATION EVIDENCE
系统优先读取 GitHub Topics,再与站内分类词典和词根规则比对。当前命中: gpu-monitoring、nvml-monitoring。
sandbaseai
Local-first, self-hosted AI agent runtime and MCP bridge with sandboxed sessions, memory, credentials, audit/replay, and a local Console.

Han-1413141
Cost tracking for DeepSeek Harness: session and model costs, token usage, budgets, provider balances, and coding-plan quotas. Bilingual English/Chinese UI.

wssfk12138
DeepSeek Harness Token 余额监控插件:鲸鱼娘待机/扣费/复苏动画、峰谷计费、连续扣费飘字与会话费用统计。