

其他
完整应用

deepseek-harness
deepseek-ai
DeepSeek Harness: Everything is a Plugin.
PROJECT TOPICS
INSTALL REFERENCE
dsh plugin --profile web add github:feiyang-dev/dsh-usage-plugin
该命令指向仓库当前默认分支;尚无绑定当前 commit 的完整验证结果。
PROJECT README
English · 简体中文
A community plugin for DeepSeek Harness — records token usage and cost for every model call, with peak/off-peak billing, balance query, a calendar heatmap, and CSV / JSON / PNG export.


🔔 Important Notice (2026-08-16): npm package renamed
The npm package has been renamed from
@feiyang666/deepseekharnessdesktopto@feiyang666/dsh-usage-plugin(matching the GitHub repofeiyang-dev/dsh-usage-plugin).
- Use the new package name for install / upgrade:
dsh plugin --profile web add @feiyang666/dsh-usage-plugin- The old package
@feiyang666/deepseekharnessdesktopremains published for a while, but it is no longer maintained and will not receive updates — please migrate soon.- The desktop client (
DeepSeek Harness Desktop) supports both package names and will auto-detect old-name installs with a one-click update to the new name.
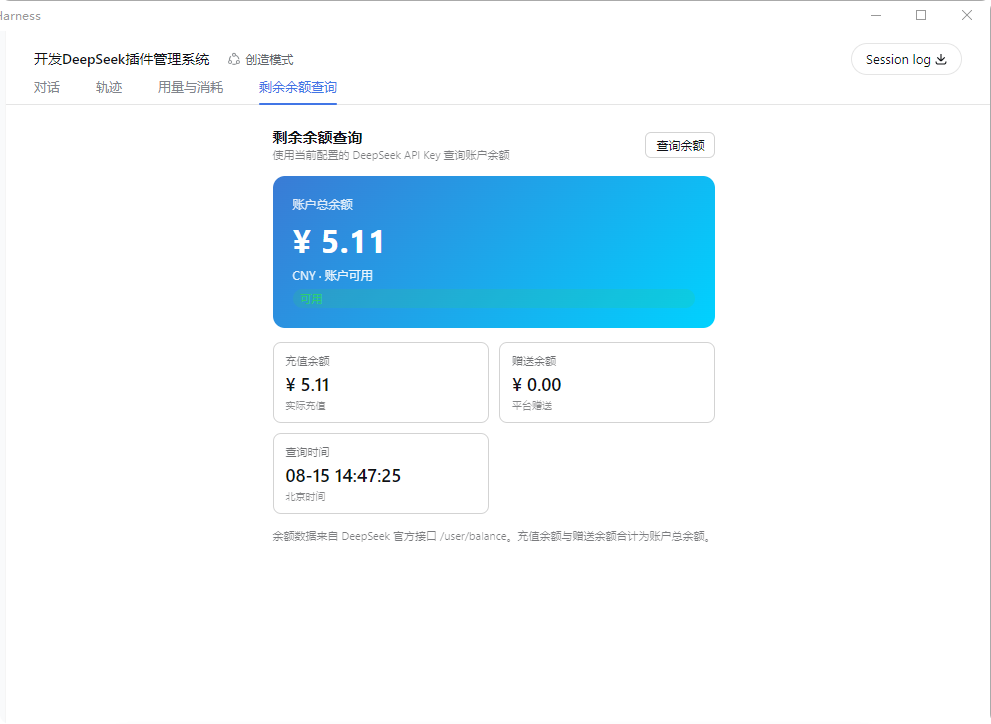
dsh-usage-plugin is a usage & cost tracker plugin in the DeepSeek Harness ecosystem (a DSH plugin shipped as a Host + Client two-in-one package). After installation, "Usage & Cost" and "Balance Query" tabs appear in the Web UI, right after "Conversation" and "Trace":
Supports Windows / macOS / Linux: paths are handled per platform (
node:path), and the folder picker / "reveal in file manager" use each OS's native mechanism (macOS:osascript/open; Linux:zenity/xdg-open). Balance query and export do not depend on Windows-only commands.
deepseek-flash off-peak cache hit 0.02 / input 1 / output 4 CNY, peak at twice that). Model names come from the actual request parameters, so non-DeepSeek models are shown truthfully instead of "unknown model"; models without an official price are counted as 0. The overview shows a by-model table plus a by-API-provider × model drill-down (each provider grouped with every model's calls and peak/off-peak cost split) and a grand total row. The overview also supports date filtering (Today / Last 7 days / Last 30 days / All, plus a custom start–end range), so the aggregate stats can be scoped to any single day or date range.— cost. The official console still counts these as API requests and bills their actual tokens, but the harness does not report their usage to the plugin — so the plugin records them at 0 tokens, keeping the call count aligned with the official console while costs are unaffected. The Overview's "Calls" card adds a · interrupted N (not billed) hint.deepseek-flash = DeepSeek-V4.1-Flash and deepseek-v4-pro; the legacy ids deepseek-v4-flash / deepseek-v4-flash-vision-exp stay callable and fold into the Flash tier) — base and peak/valley unit prices shown side by side (peak vs off-peak). The peak/off-peak tables are date-split: the first version applies from 2026-08-17, and the post-V4.1-Flash version applies from 2026-09-10 12:00 Beijing time (deepseek-flash off-peak lowered to cache hit 0.02 / input 1 / output 4 CNY, peak at twice that; deepseek-v4-pro unchanged) — past calls are always billed with the version in force at their own time. Editable in-panel and persisted to pricing.json, with a reset-to-default option.DEEPSEEK_API_KEY.<session workspace>/dsh-usage/usage-records.json and restored on restart (cap 100000 records).max-content + overflow-x) and fit the screen width on mobile (≤900px, no horizontal scrollbar); popup cards adapt to the viewport.localStorage override. The bilingual dictionary covers the whole panel, the peak/off-peak billing-period hints, the balance query and the PNG report; host-level Conversation/Settings tab labels are re-read per render, so they follow the language switch live.Token Details popup in two layers — Conversation total (the whole session's total tokens / total cost / run time / cache-hit rate) and This turn (this output's tokens, turn tokens, turn cost, turn duration, turn cache-hit rate, a cache-hit bar, and per-model cards showing each model's input·miss / cache hit / output (+ reasoning) plus its peak/off-peak cost split). Durations are shown as Xm Ys. Each usage record is tagged with the conversation (sessionId), so per-turn and per-conversation stats are computed independently.dsh2shell-* with model fake) are excluded from the model cost breakdown and collected in a collapsible "Tool calls (internal)" group below the breakdown, so only real model calls count in the cost tables.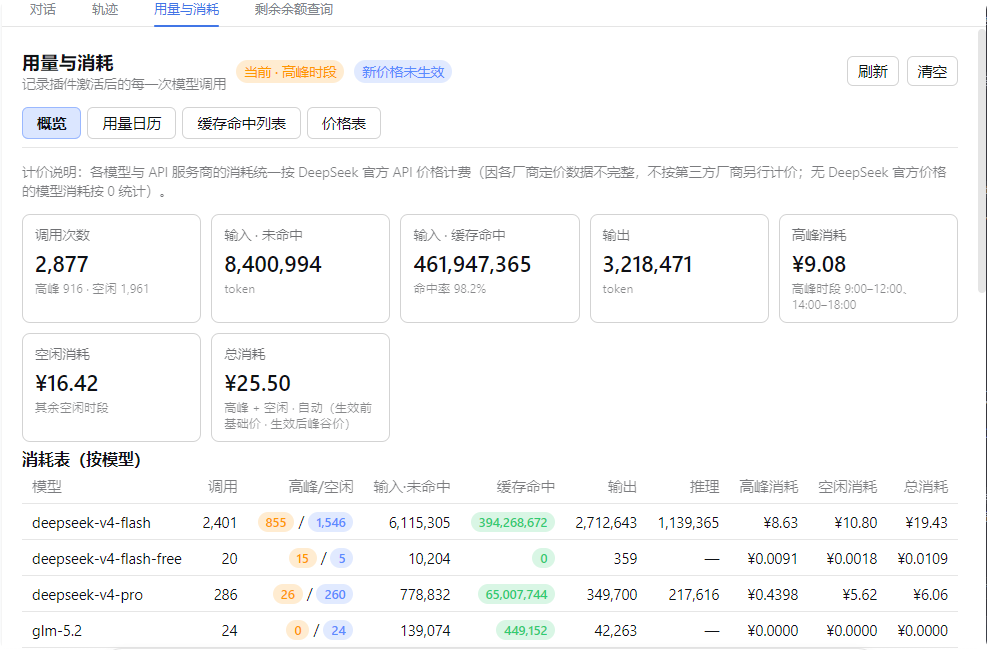
Either method works and is equivalent. We recommend the desktop app — fully graphical, no command line needed.
Install DeepSeek Harness Desktop, open it, then go to "Install Plugins" → Recommended → Usage & Cost Tracker → Install and click "Restart Service Now" to activate.
# Prerequisite: install dsh (npm install -g @deepseek-ai/dsh)
dsh plugin --profile web add @feiyang666/dsh-usage-plugin
Or install to another profile:
dsh plugin --profile web add @feiyang666/dsh-usage-plugin
dsh plugin --profile headless add @feiyang666/dsh-usage-plugin
Restart the dsh web service after installation. Detailed manual install / wiring / uninstall / troubleshooting follows below.
One npm package = a host half (Node-side Cordis plugin: recording, billing, balance query, export — see lib/index.js) + a client half (browser-side panel — see lib/client.js, which talks to the host via /usage/api).
The package integrates with DSH through two declarations:
| Declaration | Purpose |
|---|---|
dsh.bundle.patch (cordis.patch.yml) |
Lets DSH recognize it as a standard bundle plugin package: dsh plugin --profile <name> add <package> installs and wires it in one command, no manual config editing |
dsh.client + exports["./client"] |
Lets the web client auto-load the browser panel at /plugins/<package>/client.js |
So for users, installation is one command — no YAML editing, no manual file copying.
npm install -g @deepseek-ai/dsh, or a desktop app built on it, or npx @deepseek-ai/dsh web).npm install -g pnpm (or corepack enable).dsh is on PATH (for the desktop app, run in its bundled terminal).dsh plugin --profile web add @feiyang666/dsh-usage-pluginThis does three things (all automatic):
~/.dsh/profiles/web (auto-initializes the profile on first use);dsh.bundle declaration and writes the package name into the profile's dsh.profile.bundles layer list;cordis.patch.yml and mounts the plugin row into the app tree — no manual config editing.Same for other profiles (replace web with your profile name, e.g. dsh plugin --profile headless add ...; dsh web equals dsh --profile web).
Test a local tarball:
dsh plugin --profile web add C:\path\to\feiyang666-dsh-usage-plugin-1.9.0.tgz
dsh plugin)Only for when you have no pnpm or want full manual control. Do not npm install directly at ~/.dsh/profiles (that dir has no package.json; npm would treat the whole node_modules as residue and wipe it).
B1. Use pnpm but not dsh plugin:
cd ~/.dsh/profiles/web
pnpm add @feiyang666/dsh-usage-plugin
# then manually append the plugin row to web/cordis.patch.yml (see B3) and restart
B2. Or use npm: add a minimal package.json to the profile first, then install:
cd ~/.dsh/profiles/web
# if no package.json exists there yet (only after `dsh plugin` init):
# echo '{"name":"dsh-profile-web","private":true,"dependencies":{}}' > package.json
npm install @feiyang666/dsh-usage-plugin
B3. Wire it up (once, idempotent): append to ~/.dsh/profiles/web/cordis.patch.yml:
- insert:
    - id: usage-plugin
      name: '@feiyang666/dsh-usage-plugin'
      inject:
        - fs
        - webServer
        - subprocess
        - credentials
        - sandboxPolicy
        - agents
Or just run the package's built-in wiring script (auto-finds the profile and appends, idempotent):
node node_modules/@feiyang666/dsh-usage-plugin/scripts/wire.js⚠️ The
injectlist is required: it makes Cordis wait untilfs/webServer/subprocess/credentials/sandboxPolicy/agentsare ready before activating the plugin. Without it the/usage/apiroute never registers and the panel fails withUnexpected end of JSON input.
The desktop app (e.g. DeepSeek Harness Desktop) uses the same ~/.dsh/profiles underneath. Run Method A's command in any terminal, restart the app, and the plugin activates automatically (the app starts the same dsh web).
Restart the DeepSeek Harness web app (command line: kill the old process and re-run dsh web; desktop: fully quit and reopen). Then:
"Balance Query" uses the configured DEEPSEEK_API_KEY: set the API Key in Settings → Models (same key used for chats), then open the "Balance Query" tab and click "Query Balance".
dsh plugin --profile web remove @feiyang666/dsh-usage-plugin(Equivalent to pnpm remove; dsh plugin auto-removes the package name from the dsh.profile.bundles layer list.) Restart the app afterward.
For manual installs (Method B), do it in reverse: remove the usage-plugin row from cordis.patch.yml, then pnpm remove / npm uninstall the package, and restart.
Upgrading from a 1.0.x manual-wiring install to 1.1.x: first remove the old
usage-pluginrow fromcordis.patch.yml(or follow the uninstall flow), then reinstall via Method A to avoid mounting the plugin twice.
Releasing happens on npm, so updating just means pulling the latest published package. Your usage history is safe — since v1.9.2 it lives in a fixed dedicated directory (not in any profile / workspace), so an update never wipes it.
Open "Install Plugins" → find Usage & Cost Tracker → click Update (or Re-install) → "Restart Service Now". If there is no Update button, just remove then re-add it.
Re-running add is idempotent and pulls the newest version:
dsh plugin --profile web add @feiyang666/dsh-usage-plugin
dsh web   # restart
Pin a specific version:
dsh plugin --profile web add @feiyang666/dsh-usage-plugin@1.9.3In the profile dir:
cd ~/.dsh/profiles/web
pnpm update @feiyang666/dsh-usage-plugin # or: npm update @feiyang666/dsh-usage-pluginnpm ls @feiyang666/dsh-usage-plugin --prefix ~/.dsh/profiles/web⚠️ Do not hand-edit files under
~/.dsh/profiles/web/node_modules/@feiyang666/dsh-usage-plugin/(e.g.lib/index.js/lib/client.js). Every update re-extracts the package from npm and overwrites those files, so local edits are silently lost. To change behavior, fork the repo and publish your own version, or contribute upstream.
Since v1.9.2, records are stored in a fixed, dedicated data directory (fixes #4). The path no longer follows the session workspace /
~/.dsh/ desktop-app install dir, so your history never "disappears" (counted as 0) when the workspace changes, and the path shown in the UI equals the on-disk path.
<data root>/dsh-usage/usage-records.jsonDSH_USAGE_DATA_DIR (if set) — overrides everything;%LOCALAPPDATA%\dsh-usage-plugin (falls back to %APPDATA% if LOCALAPPDATA is unset);~/dsh-usage-data (Windows %USERPROFILE%\dsh-usage-data, macOS/Linux ~/dsh-usage-data);<workspace>/dsh-usage — only used when all system/user dirs above are unwritable, and the panel will show a "persistence disabled" warning.workspace-write sandbox, so the fixed directory is always writable and data is not lost when switching workspaces.%LOCALAPPDATA%\dsh-usage-plugin\dsh-usage\usage-records.json%USERPROFILE%\dsh-usage, ~/.dsh/dsh-usage, and each workspace's dsh-usage (or .dsh-usage-records.json) are merged into the fixed root, deduplicated by record identity — the recordId of new records, or a composite fingerprint (session + timestamp + model + purpose + four token buckets + finish reason) for legacy ones. This is no longer a millisecond-only comparison, so two different requests inside the same millisecond no longer overwrite each other. Records written by older versions stay fully readable: missing recordId / pricingTime / unit and friends are all optional.usage-records.json.corrupt-<timestamp>.json and keeps starting, so the data can be recovered by hand.<data root>/dsh-usage/pricing.json<data root>/dsh-usage/{csv,json,images}/dsh-usage-boot.log next to the data rootUsage and cost here are recorded call by call from DeepSeek Harness llm/stream events, plus a session/event listener for search-backend requests. Read the boundaries below before relying on the numbers.
| Source | Notes |
|---|---|
| Main agent conversation | Four token buckets, cache-hit counts and finish reason per call |
| Session-title generation | purpose: session-title |
| Context compaction | purpose: compaction |
| In-process subagents | They share the main agent's ctx.llm, so they are intercepted too |
The billing formula matches the official one: uncached input × miss price + cache hit × hit price + output × output price. There is no separate cache-write price (DeepSeek never reports that field; writing to cache is charged at the miss price), and reasoning is already included in output, so it is never billed twice.
| Source | Why it is unreachable | What the plugin does |
|---|---|---|
DeepSeek search backend calls from web_search |
web-search-deepseek issues a native fetch straight to api.deepseek.com/anthropic/v1/messages inside the Harness, deliberately bypassing ctx.llm; upstream only persists the request (web/deepseek-search-llm-request) and discards the response usage entirely (its response type does not even declare a usage field). No data source exposes this spend. |
Records the exact call count and derives a lower bound for the input side from the request body, all flagged estimated. The output side is never guessed. The overview shows "estimated cost ≥ ¥X (N calls)". |
| External CLI subagents (claude-code / codex) | Separate child processes, fully outside ctx.llm, emitting no events |
Not counted |
| Output produced before an aborted request | The adapter emits no usage chunk on abort | Recorded as a zero-token "interrupted call" so the call count still matches the console |
| Official billing counts HTTP requests; the plugin counts streams | Harness-level retries do not open a new stream | Call counts may differ from the official request_count |
web_search use the plugin's total is materially lower than the official bill — the gap is the search backend, and the panel says so explicitly;Each record freezes the three unit prices in effect when it was written (its unit field). Therefore:
pricing.json) only affects future records; past costs are not recomputed;{"action":"repriceAll"}). That is the only entry point that rewrites historical cost.| Symptom | Cause / Fix |
|---|---|
Panel reports Unexpected end of JSON input |
The plugin row is missing the inject list, so the route isn't registered. Add the inject list per Method B3 and restart |
| Panel blank / no top tab | Plugin not activated. Check dsh-usage-boot.log; confirm the cordis.patch.yml row exists with the correct name |
| Balance query fails with "DEEPSEEK_API_KEY not configured" | Set the API Key in Settings → Models |
| Balance query network error | Ensure api.deepseek.com is reachable (configure a proxy if needed) |
dsh plugin reports pnpm not found |
Install pnpm: npm install -g pnpm |
| Install can't reach the npm registry | Set a mirror: npm config set registry https://registry.npmmirror.com (or pnpm config set registry ...) and retry |
After uninstall, still reports Cannot find package '@feiyang666/...' |
A package reference remains in the profile. Remove the corresponding row from cordis.patch.yml and the package name from dsh.profile.bundles, then restart |
| Project | Description | Installation |
|---|---|---|
| DeepSeek Harness Desktop | Windows desktop console: install/start/stop/restart the dsh web service with one click, built-in plugin management — install this plugin from its Recommended section | Download the desktop app and click a few buttons |
| Data Vault (dsh-vault) | Auto backup / wipe detection / one-click restore — protects chat history and workspace data | One-click from the desktop app, or dsh plugin add @feiyang666/dsh-vault |
| DeepSeek-Harness | Official CLI / Web service | Quick start below |
Quick start (via npm)
Install Node.js, then run:
npx @deepseek-ai/dsh webThis command starts the Web UI at the default address http://127.0.0.1:3080. See the Web UI Guide for details.
Run from source
To run from the repository source:
git clone https://github.com/deepseek-ai/deepseek-harness.git
cd deepseek-harness
pnpm install
pnpm run build
pnpm dsh webcacheWriteTokens fallback double-counting the four buckets, millisecond-only dedup overwriting records, and non-atomic writes silently zeroing a corrupt file — became the basis for the v1.18.0 metering fixes (see CHANGELOG).MIT © dsh-usage-plugin
CLASSIFICATION EVIDENCE
系统优先读取 GitHub Topics,再与站内分类词典和词根规则比对。当前命中: 无有效分类标签。
deepseek-ai
DeepSeek Harness: Everything is a Plugin.

anywhere-labs
为 DeepSeek Harness (DSH) 插件生态打造的现代化桌面端解决方案。万物皆「插件」,桌面本身也是「插件」。

walkinglabs
Harness engineering beginner tutorial, from 0 to 1