其他
完整应用

deepseek-harness
deepseek-ai
DeepSeek Harness: Everything is a Plugin.

YLifeOnlyOnce/dsh-calendar
See at a glance what DeepSeek did, and when. 📅 A beautiful usage calendar for DeepSeek Harness — every project and task's execution time, 🎡 in day / 7-day / month / year views, with recurring reminders, animations, and full theme awareness.✨
PROJECT TOPICS
INSTALL REFERENCE
dsh plugin --profile web add github:YLifeOnlyOnce/dsh-calendar
该命令指向仓库当前默认分支;尚无绑定当前 commit 的完整验证结果。
PROJECT README
See at a glance what DeepSeek did, and when. A beautiful, theme-aware usage calendar for DeepSeek Harness — every project and task's execution time, in day / 7-day / month / year views.
English | 中文



Four time perspectives of your DeepSeek usage — light and dark both follow DSH.
🗓️ Year & 🗂️ Month
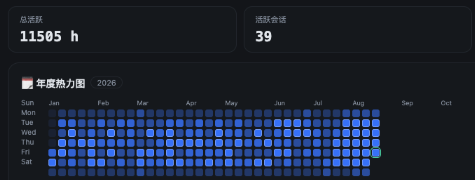 Year |
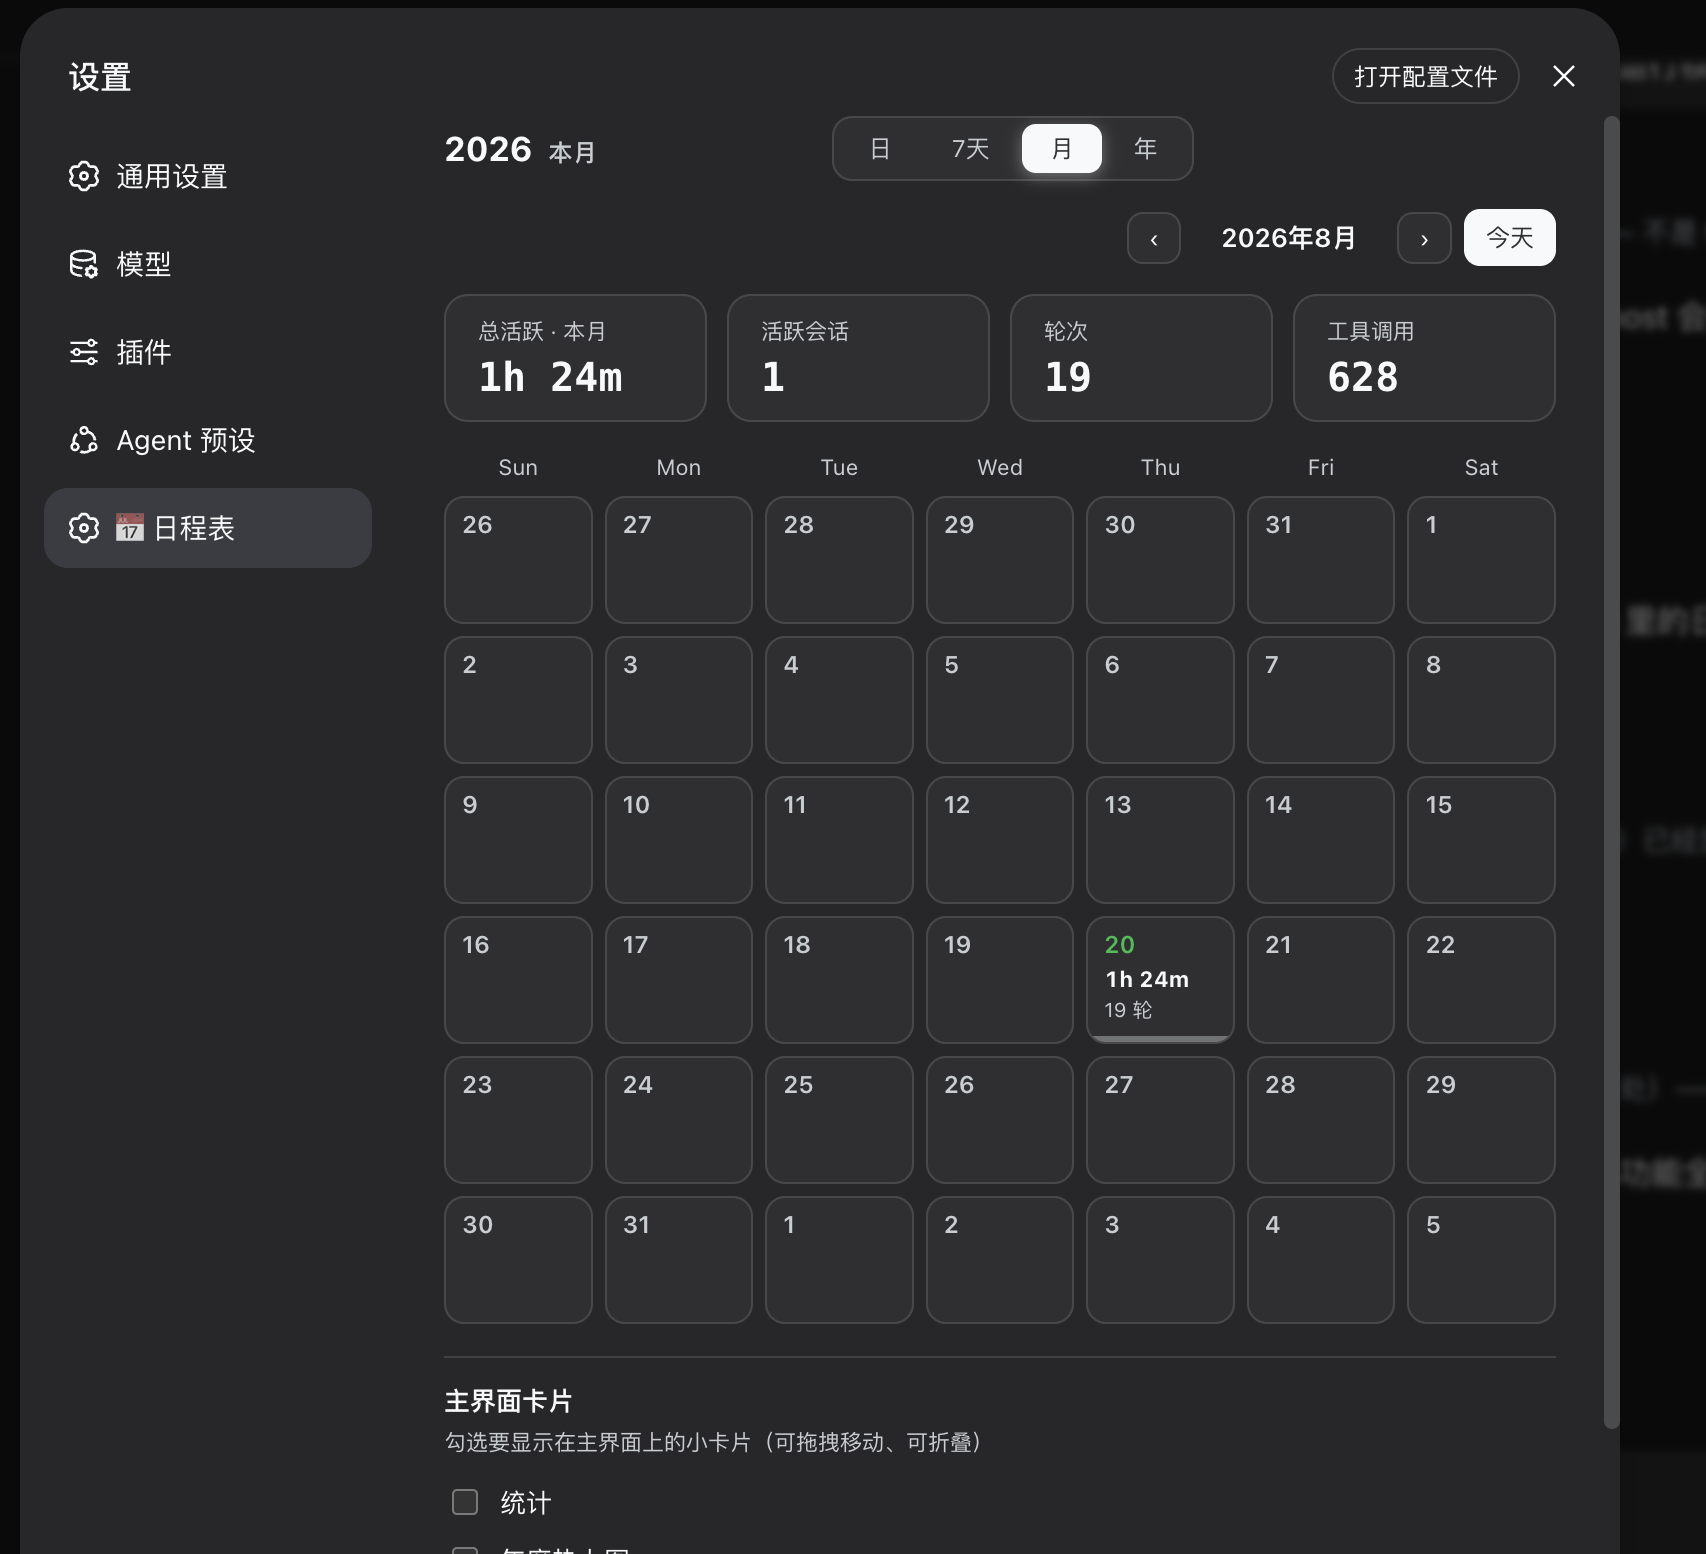 Month |
📅 7-day view
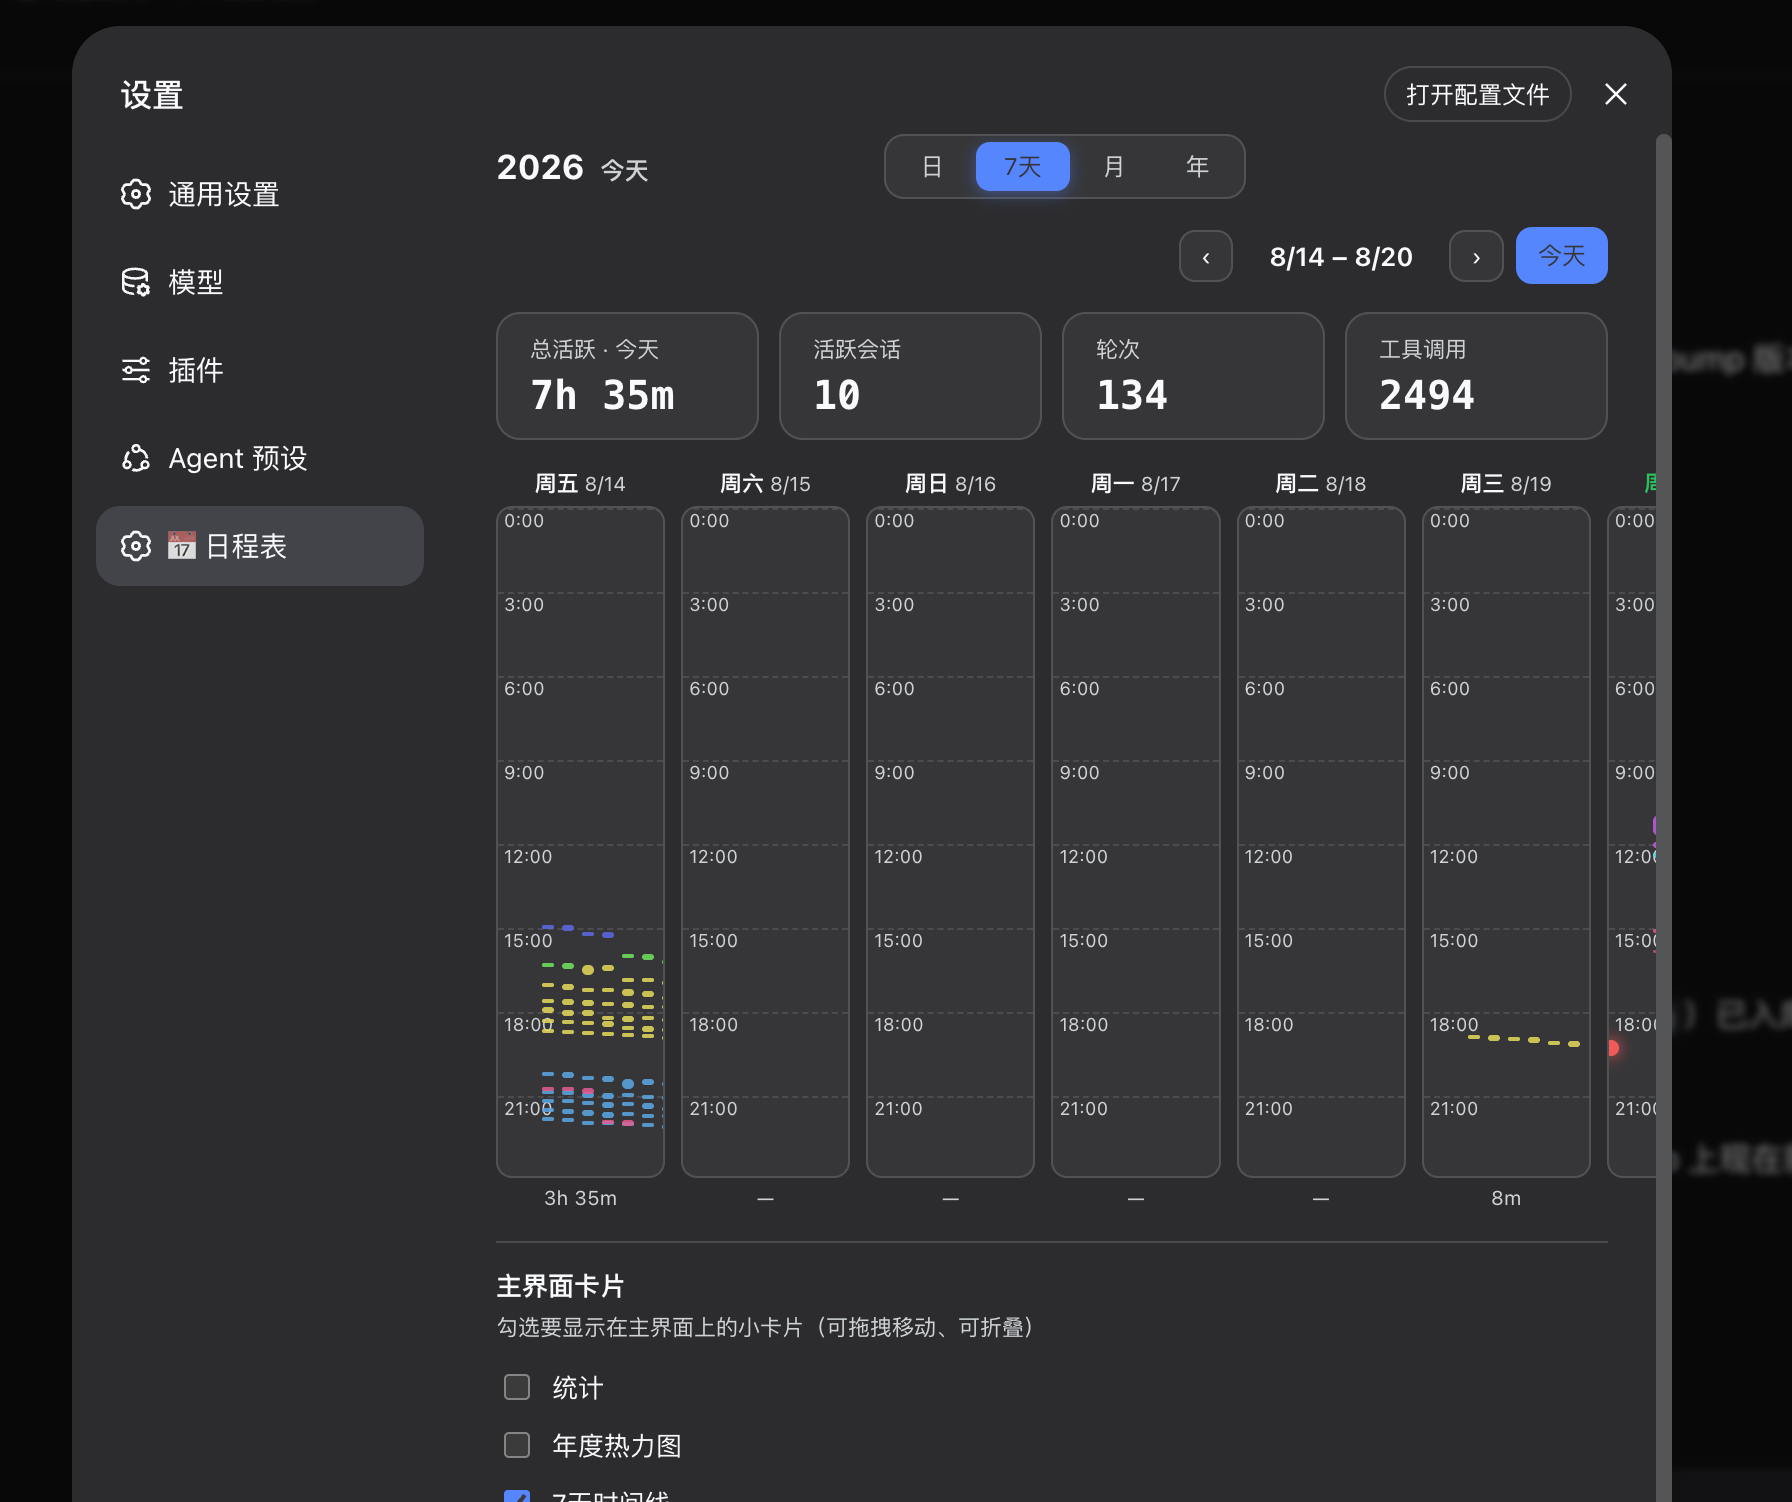 🌙 Dark |
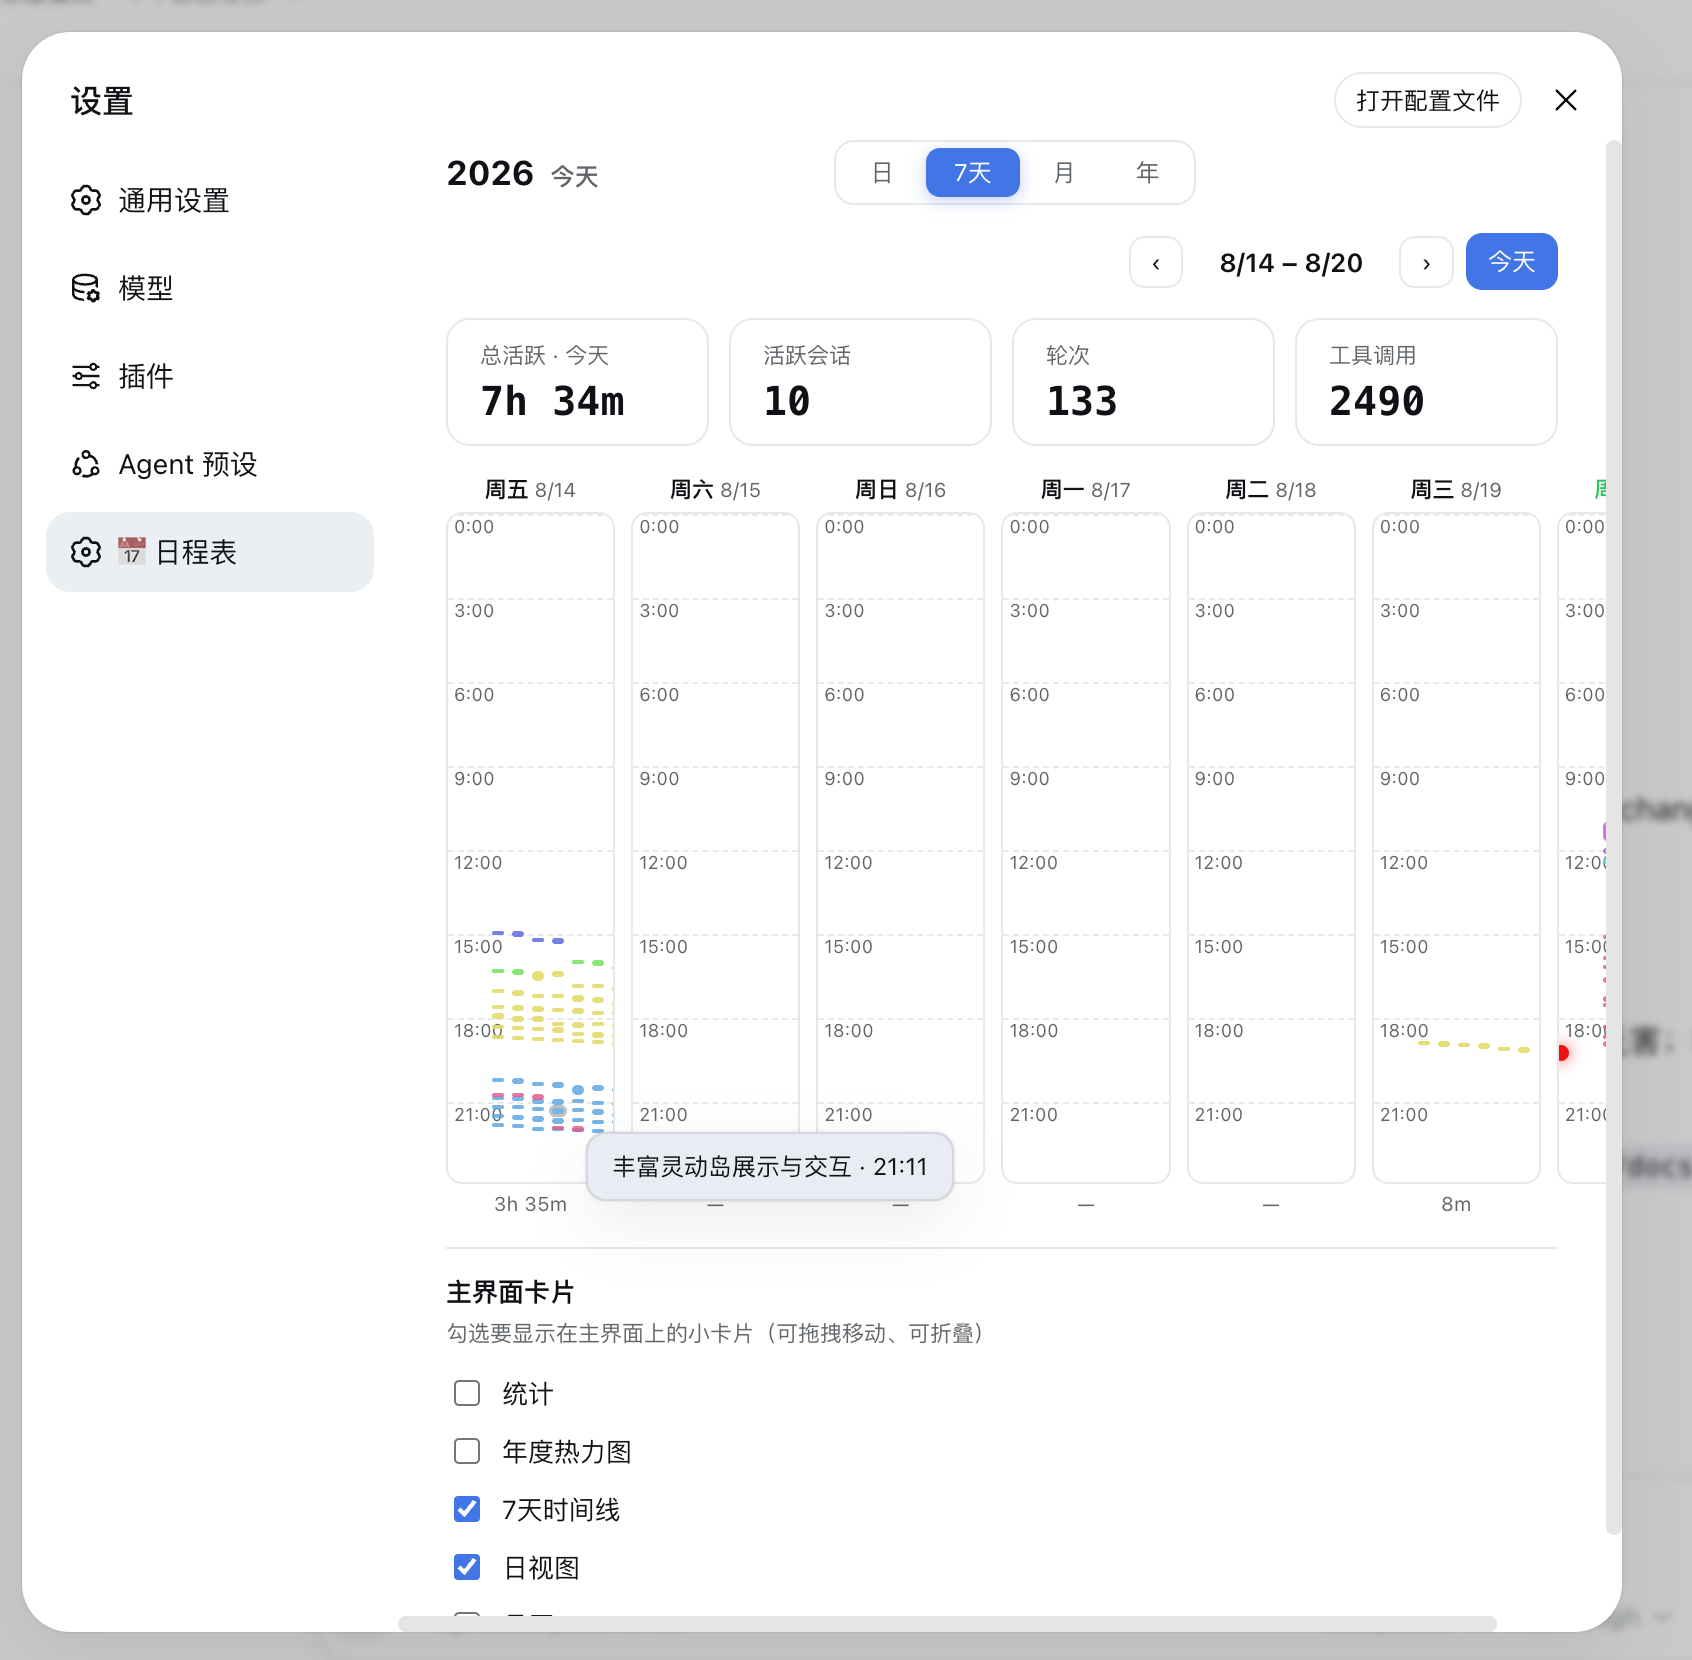 ☀️ Light |
⏱️ Day view
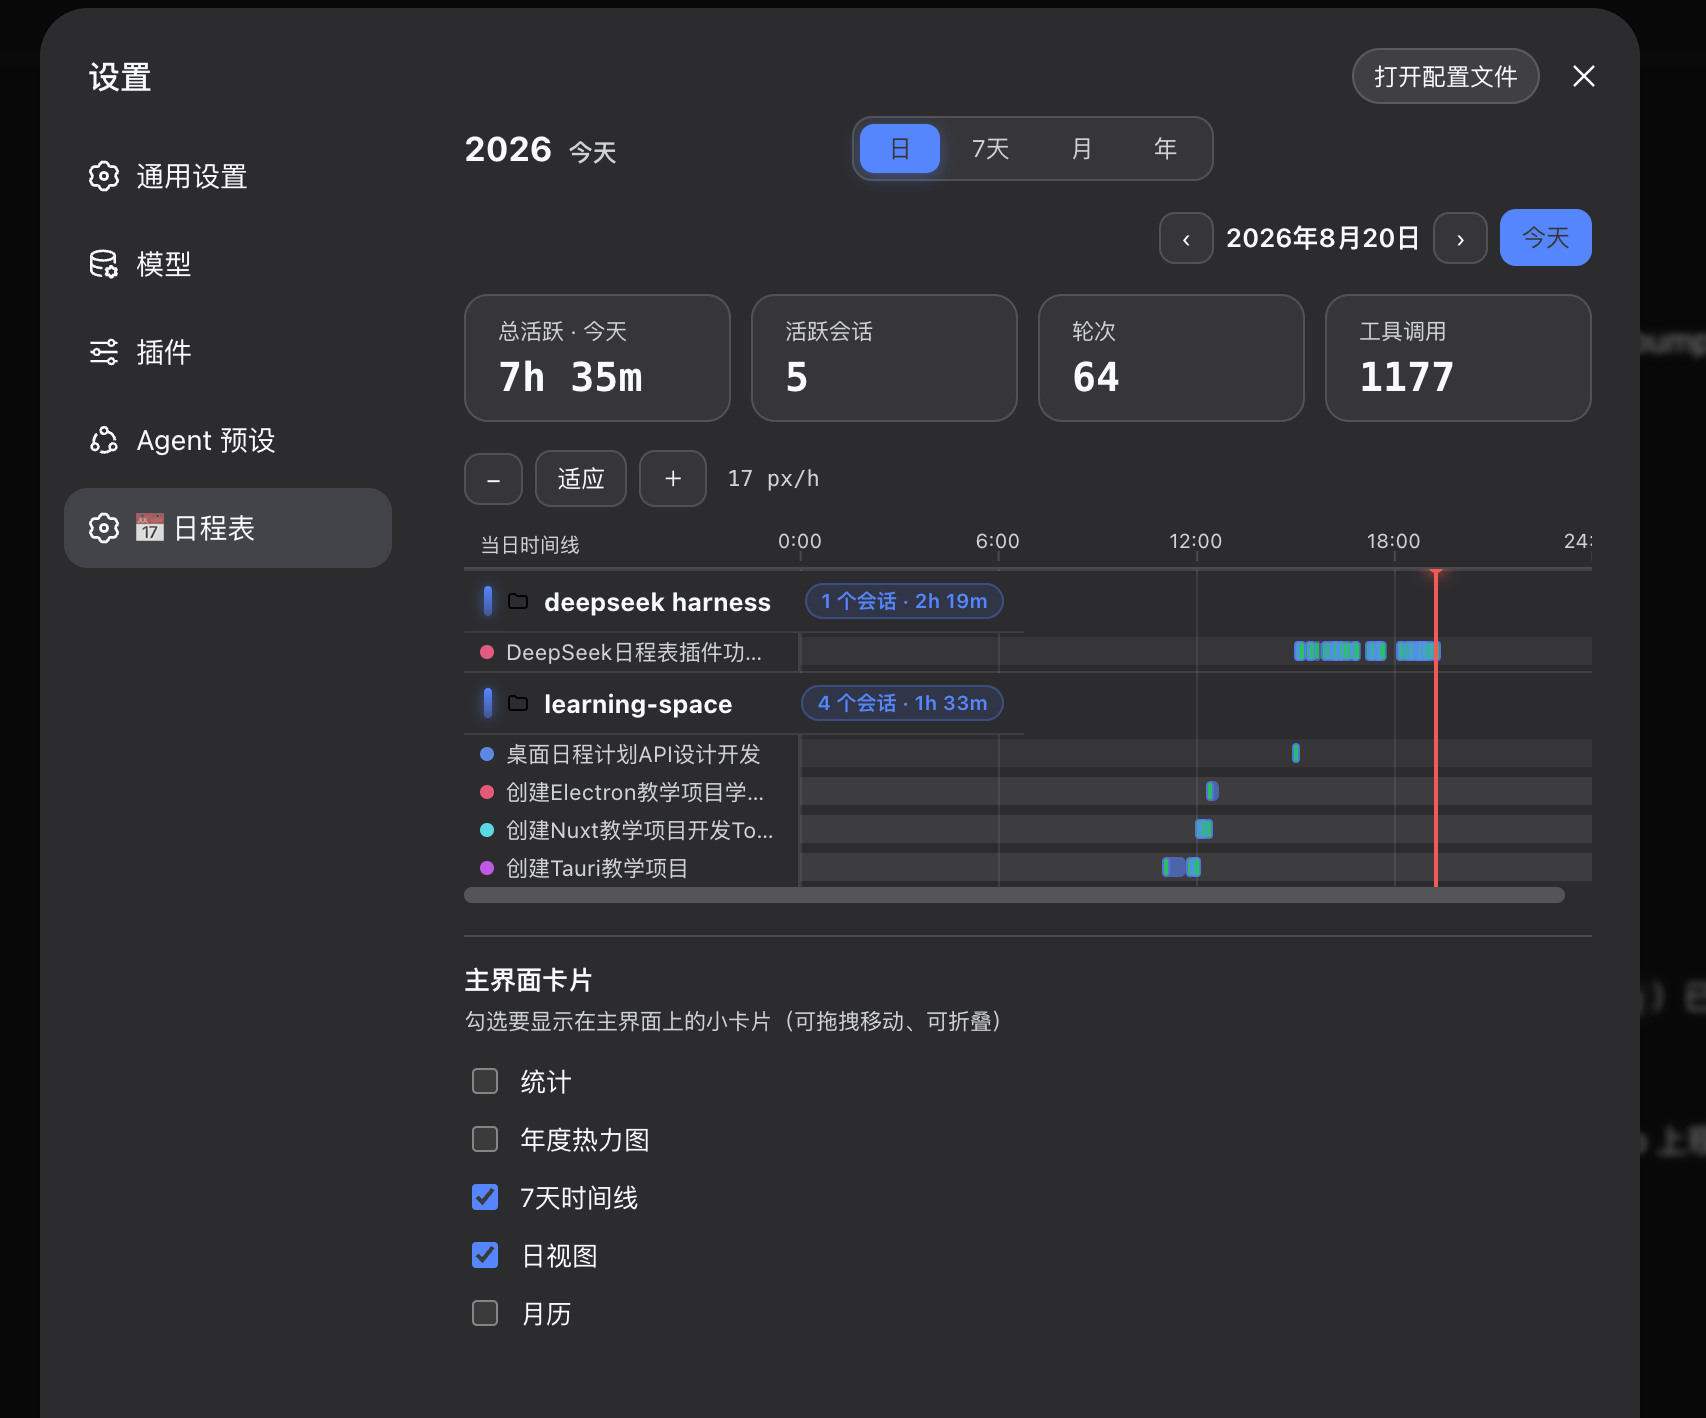 🌙 Dark |
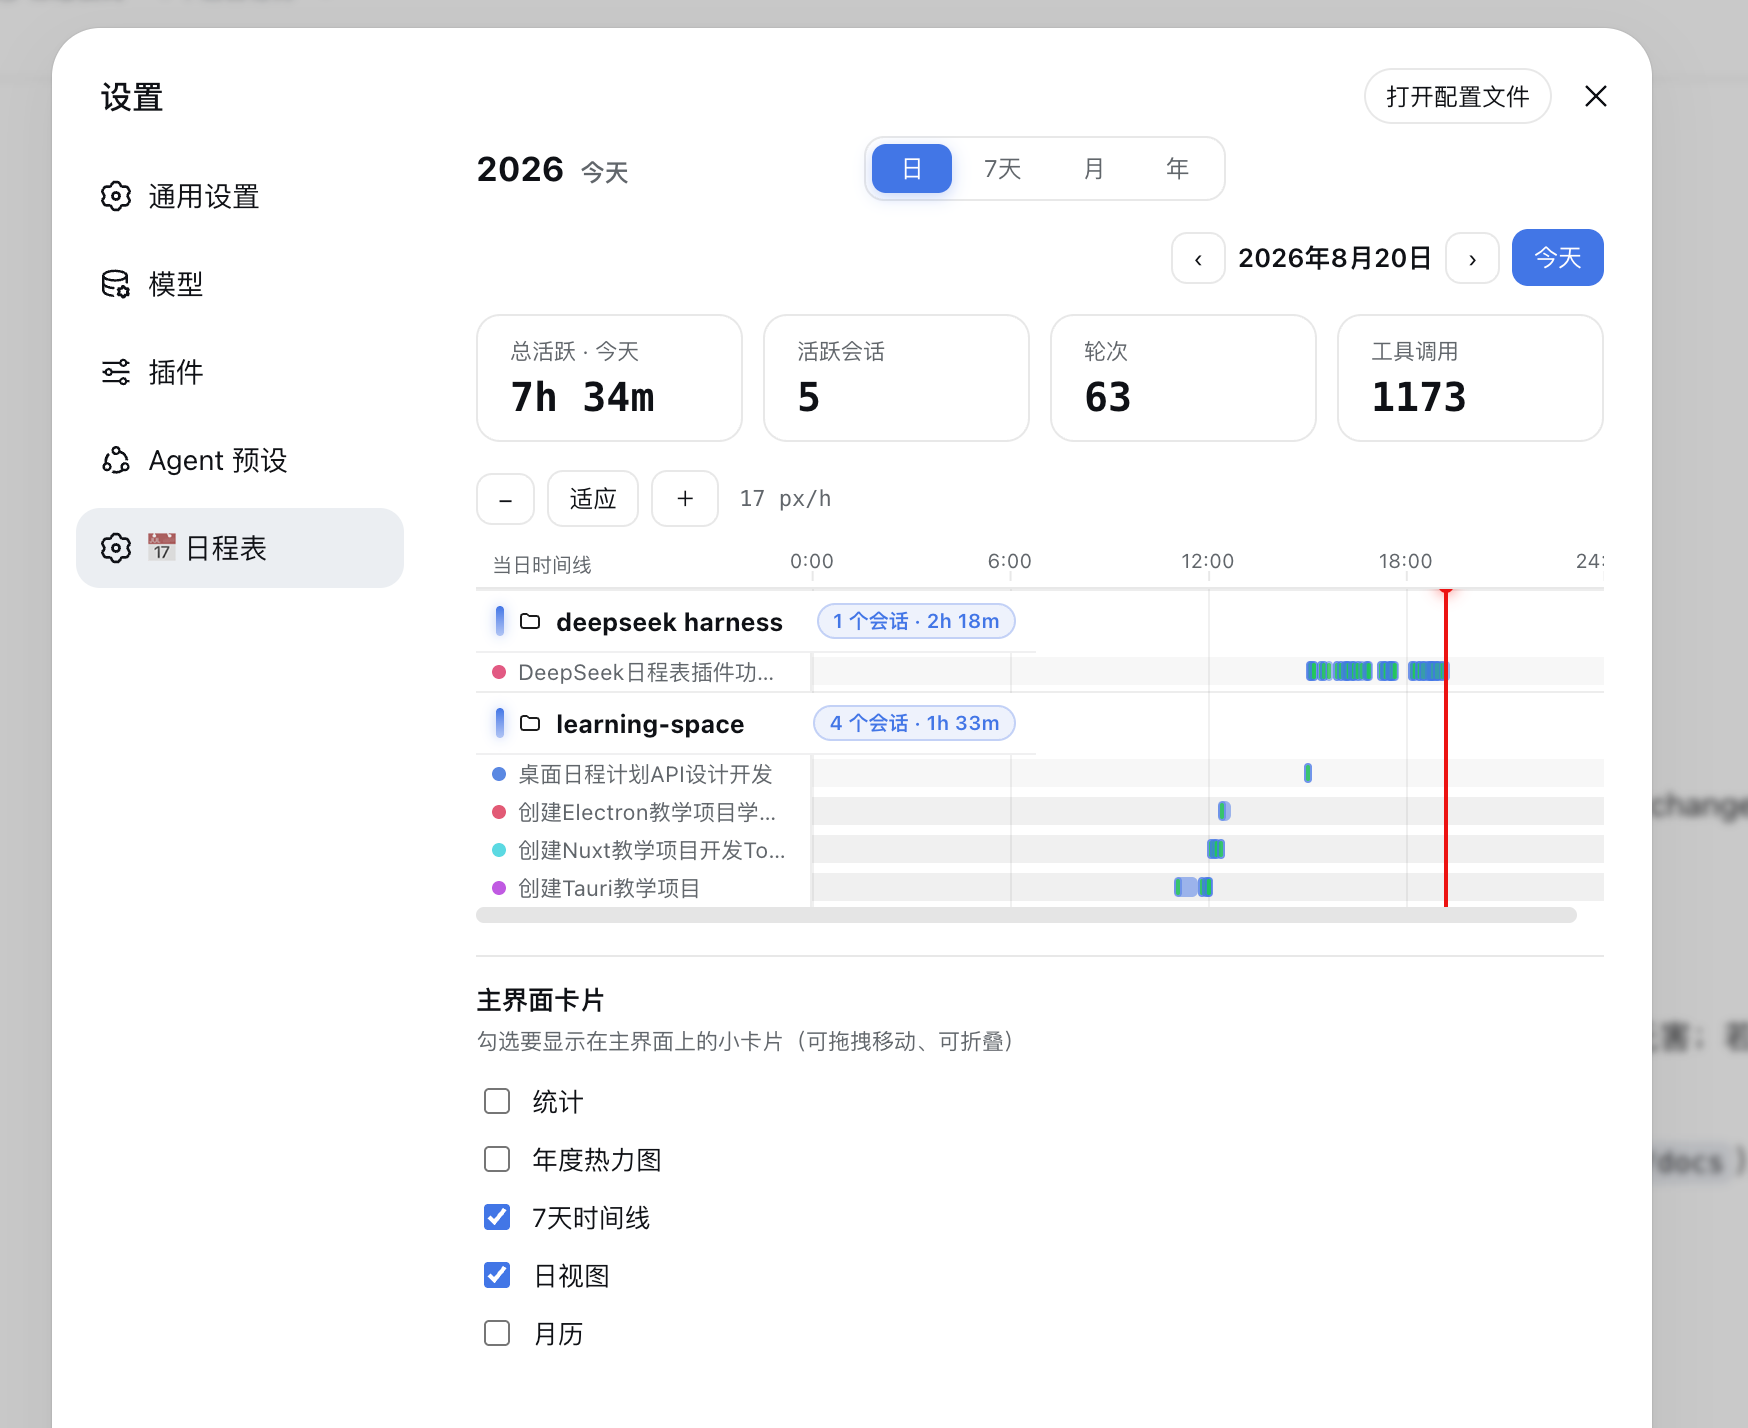 ☀️ Light |
🃏 Main-UI cards
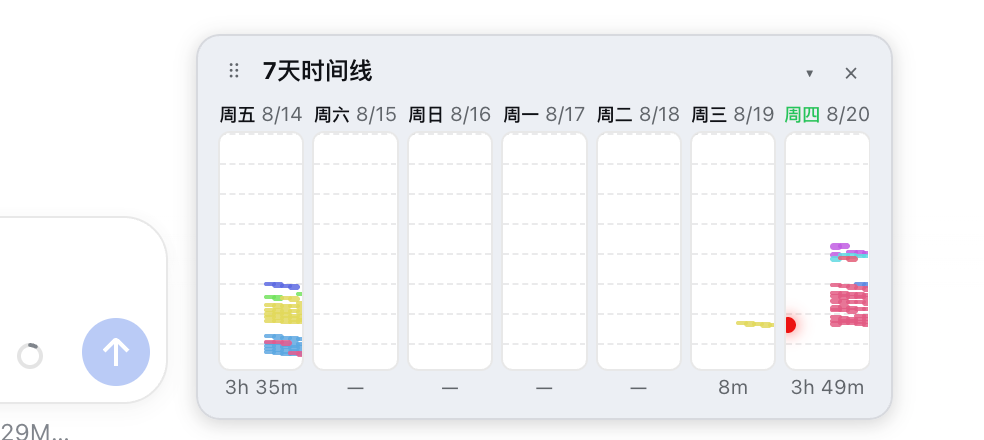 7-day |
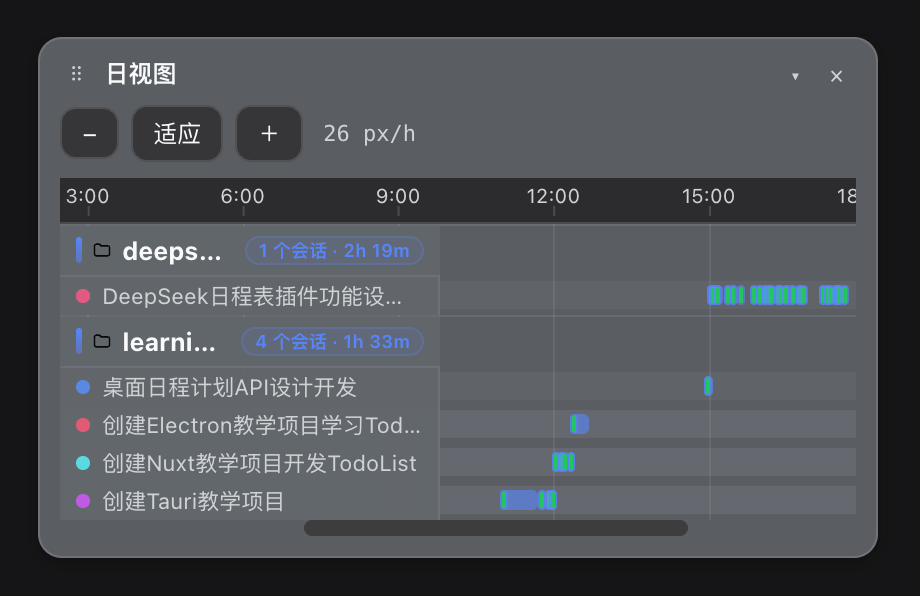 Day · 🌙 Dark |
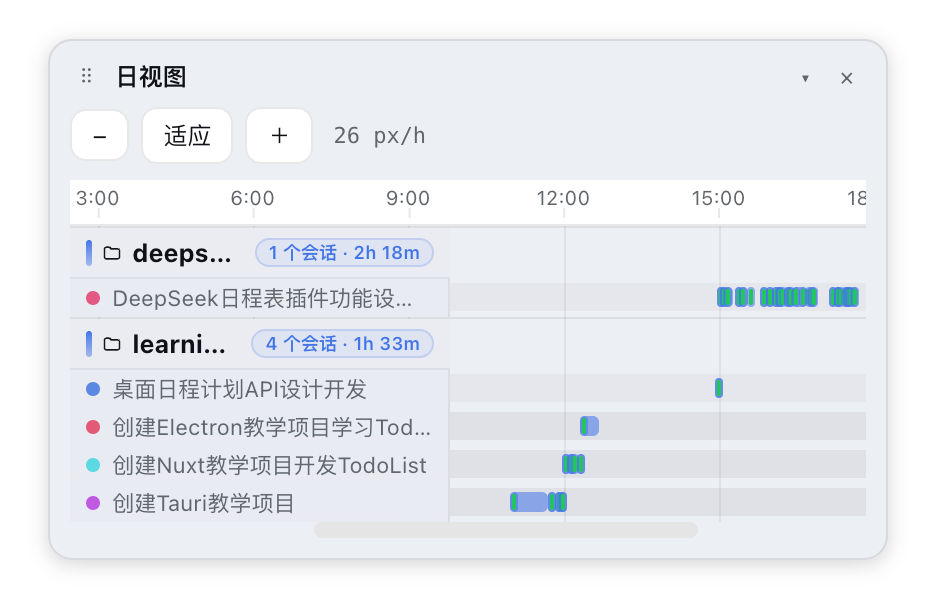 Day · ☀️ Light |
You use DeepSeek Harness every day — dozens of sessions, background jobs, scheduled reminders. But there was never a way to see the work: when each project ran, for how long, how much tool activity happened, or when the next recurring task fires.
dsh-calendar turns your existing usage history into a beautiful calendar — zero configuration, no extra data store, nothing to maintain. Install, restart, open Settings → 📅 Calendar, and your entire history is there.
| 🗓️ Year heatmap | GitHub-style 52×7 contribution map — spot your busiest seasons at a glance |
| 📅 7-day timeline | Seven columns, one day each, a vertical 24-hour timeline. Every session keeps its own color, so you can trace one task across days |
| ⏱️ Day timeline | 24-hour Gantt axis by workspace → session. Turns merge into task segments — one user prompt opens a task, the work that follows joins it, one bar per task |
| 🗂️ Month grid | Classic calendar with per-day heat bars and totals |
| 🃏 Main-UI cards | Draggable mini cards (stats / year / 7-day / day / month) float over the main interface — move, collapse, or close them; pick which ones show in Settings. Frosted translucent cards with soft shadows, so they sit lightly on top of your work |
| 🏷️ Workspace headers | Timeline rows carry a folder icon, a glowing accent bar, and a pill badge with session count + active time — at a glance, per workspace |
| 🖱️ Drill through | Click any timeline bar to open the actual conversation |
| 📊 Stats strip | Active time / sessions / turns / tool calls / tokens for the selected range, with count-up numbers |
| 🪙 Token usage | Billed token accounting per day / session / workspace — exact when the provider reports usage, heuristically estimated otherwise |
| 🎨 Theme-aware | Follows the harness theme — light and dark, automatically; bars and heat use the real brand blue in both themes |
| ✨ Animations | Gentle entry effects and a decrypt-reveal headline — nothing janky, nothing in the way |
| 🕐 History, out of the box | Past sessions are folded and cached at startup — last month's activity is visible without opening anything |
| dsh-usage-calendar | DeepSeek Harness |
|---|---|
| 0.1.4 | 0.1.1-rc.1 (next) — adapted to the session-projection stateSchema / wire unit contract; @deepseek-ai/dsh-client-web-react removed (merged upstream) |
| 0.1.0 – 0.1.3 | 0.1.0-rc.7 |
dsh plugin --profile web add dsh-usage-calendarRestart dsh web, then open Settings → 📅 Calendar.
‹ › steps, Today jumps back.▾, close ×; re-enable in Settings → Calendar → Main-UI cards.▶️ Live demo: open the showcase page — hero banner, four views, and the main-UI cards, ready to screenshot.
No live harness needed to preview the visuals locally either — the repo ships a demo page with rich sample data (dark/light switchable):
pnpm demo:build && open docs/demo.htmlWrapped report + shareable PNG exportCLASSIFICATION EVIDENCE
系统优先读取 GitHub Topics,再与站内分类词典和词根规则比对。当前命中: 无有效分类标签。
deepseek-ai
DeepSeek Harness: Everything is a Plugin.

anywhere-labs
为 DeepSeek Harness (DSH) 插件生态打造的现代化桌面端解决方案。万物皆「插件」,桌面本身也是「插件」。

walkinglabs
Harness engineering beginner tutorial, from 0 to 1