Agent Dashboard: Visualization and analytics for Sessions and Quota Usage. Track, analyze, and optimize token usage across providers with heatmaps, cost tracking, token counting and quota resets..
[!NOTE]
Multiple machines, one dashboard. Add the Tokdash instances running on WSL, a Mac, or any other box in Settings: every view combines whatever you select, the Servers tab compares the machines side by side, and the Quota tab keeps each provider's window bars and reset countdowns grouped per machine. Remote access → · quota tracking →
Also from the same author: Cosyncing. Synchronize and control your agents — from CLI to GUI, from desktop to phone. Cosyncing keeps your coding agents in sync across your own network.
That's it. tokdash setup detects the runtime, installs a managed one if
needed, registers a local service, and prints the dashboard URL —
http://127.0.0.1:55423. Full options, first-run notes, and updates live in
Install & run; prefer to look around first? The
live demo runs on the real UI.
One package, four views
One local package, one local data index — and four ways to read it. Every surface
parses the same session logs on your own machine, so the browser dashboard, the
terminal, the menu bar, and your agent's statusline always agree.
A live token/cost item inside your agent's statusline
You want the cost ticker exactly where you type
WebUI
The dashboard is a single page served by the local FastAPI app: exact input /
cache / output token breakdowns, per-tool and per-model tables, a contribution
heatmap, a week/month/year Report, per-provider Quota windows with reset
countdowns, and a Servers tab that combines and compares several machines.
Click any screenshot to open the live demo.
Overview
Usage Report
Quota tracking
Multiple servers, one total
Light and dark follow your OS appearance. The app ships 17 style themes, light/dark modes, PWA install, and six UI languages (English / 中文 / 日本語 / 한국어 / Español / Português).
Terminal dashboard (TUI)
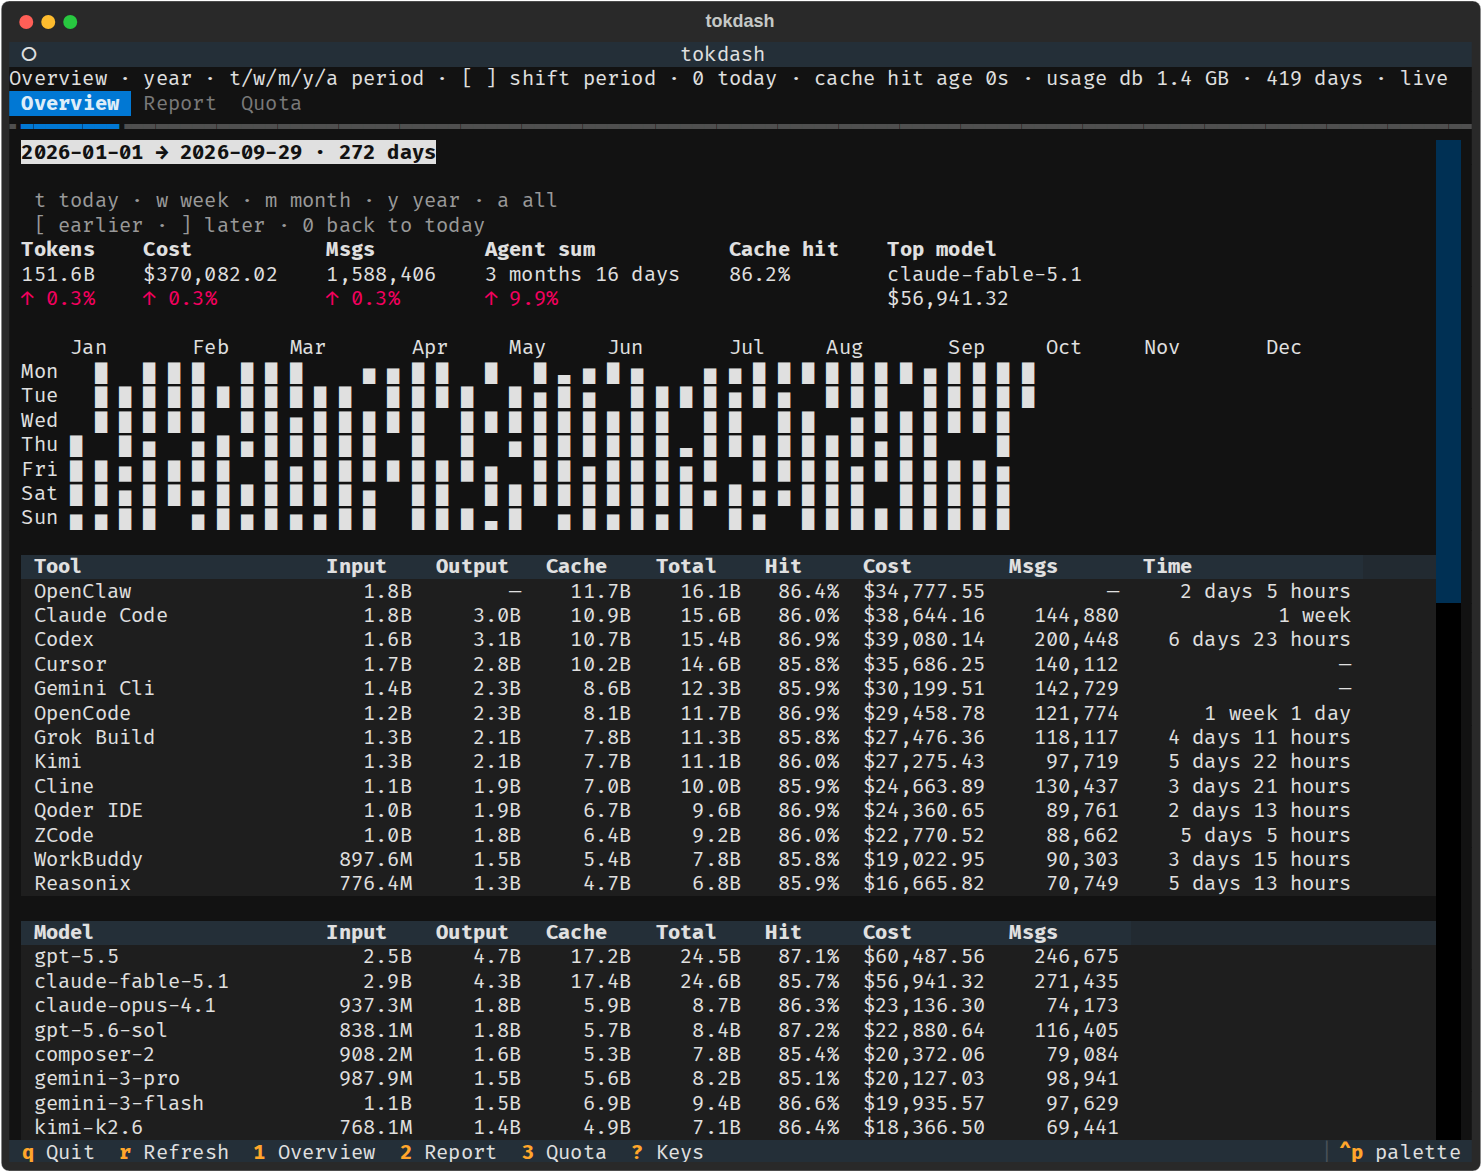
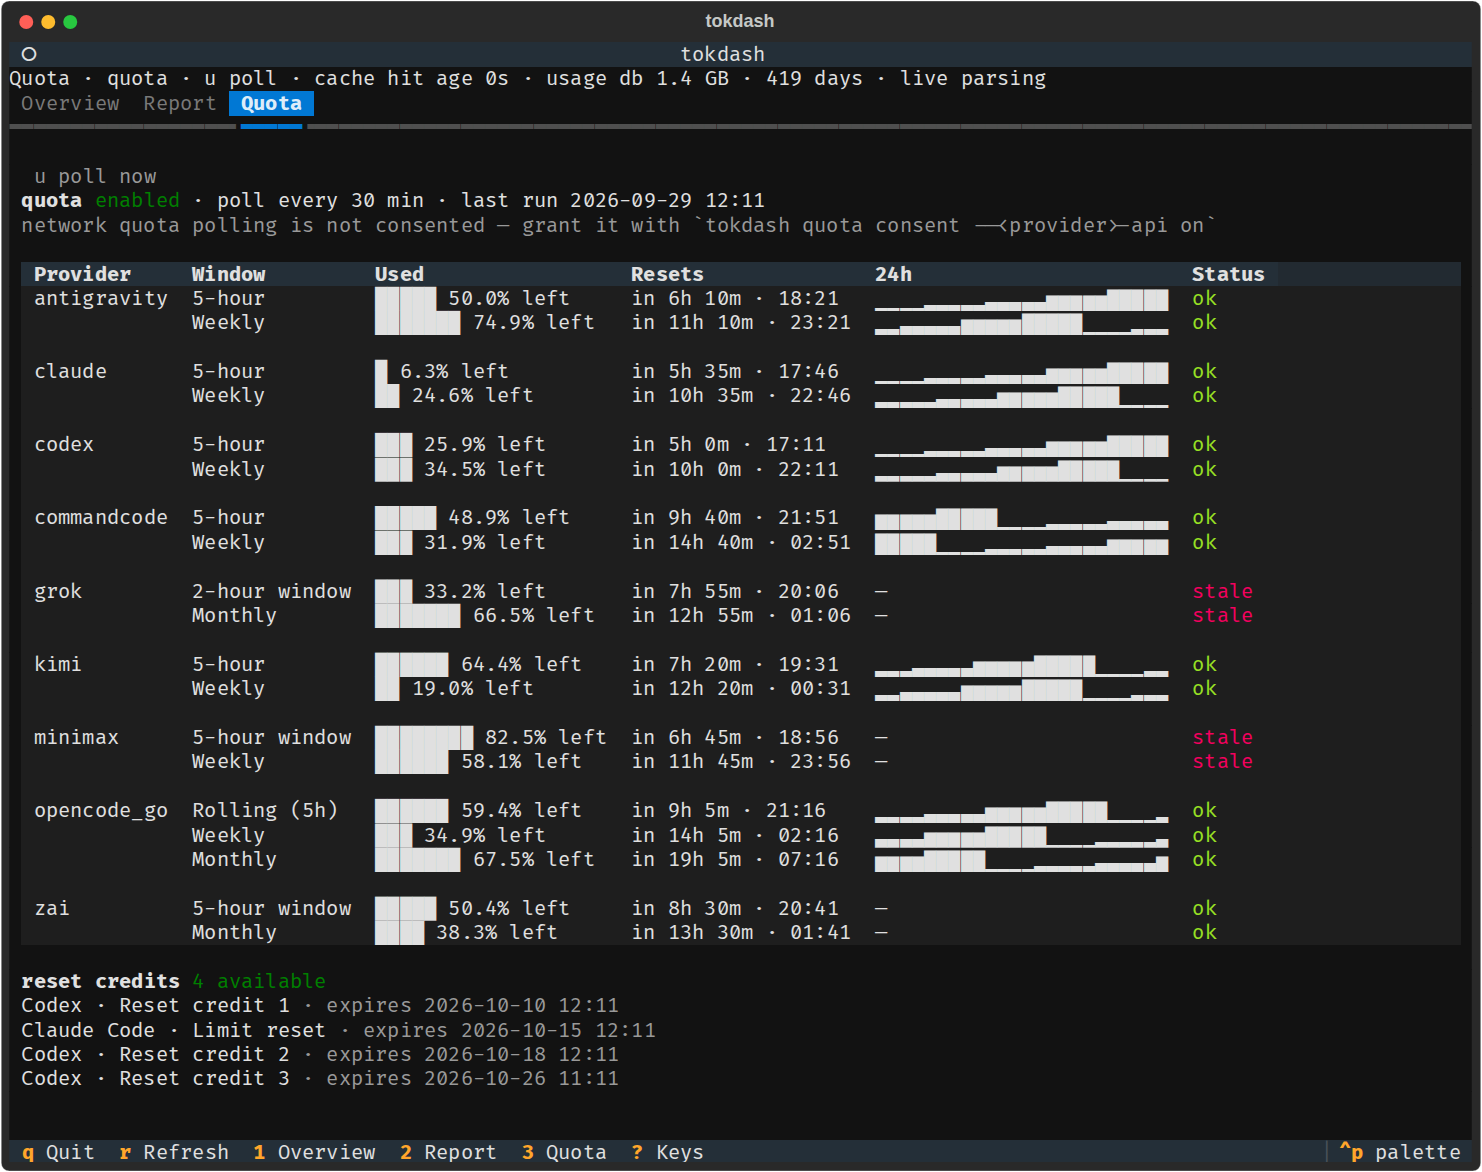
Prefer to stay in the terminal? tokdash tui opens the Overview, Report,
and Quota tabs without a browser, reading the same local index (and the
shared on-disk database when a tokdash serve is running beside it).
TUI — Overview
TUI — Quota
tokdash tui
Keyboard
Key
Action
q
Quit
r
Refresh the current tab
1 / 2 / 3
Switch to Overview / Report / Quota
twmya
Jump to a period directly (both period tabs; t/a are Overview-only)
p
Next time window (forward-only cycle)
[ / ]
Step one whole calendar period back / forward — never into the future
0
Back to today
u
Poll quota (Quota tab only)
?
Help overlay with all keys
One-shot report CLI
For a one-shot report you can pipe or script:
tokdash report --period week
The period is a flag, not a positional argument. Accepted values: today (the
default), week, month, year, all, a number of days, or Nd/Nw/Nm/Ny
shorthand; week, month and year are the same calendar-aligned windows the
web Report tab shows. tokdash report also accepts --json, --pretty and
--output <file>, following the same conventions as tokdash export.
Companion status bar app
An optional native menu-bar app for macOS and notification-area app for Windows:
a compact, read-only view of the Tokdash service without the dashboard open.
macOS menu bar
Windows notification area
Windows — Microsoft Store (recommended, signed by Microsoft, requires Windows 11):
Direct download — the latest companion release:
a universal DMG (arm64 + x86_64, macOS 14+) and a self-contained portable ZIP
(x64, Windows 11; Windows on Arm via x64 emulation).
What it shows, and how setup works
Today's cost, tokens, messages, and month-to-date usage
Combined totals and server-grouped quota from multiple Tokdash endpoints
Codex, Claude, Kimi, MiniMax, Antigravity, Grok, and Z.ai quota windows
Relative reset times and optional low-quota notifications
System language detection plus English, Simplified Chinese, Japanese, Korean, Spanish, and Portuguese
No telemetry, credential discovery, port scanning, or direct log parsing
Setup: run Tokdash 1.5.2 or newer (Install & run), install the
companion, and it connects to http://127.0.0.1:55423 by default — its settings
let you add, test, name, or remove explicit endpoints, including private Tailscale
Serve URLs. The companion only contacts the endpoints you configure; low-quota
notifications and launch at login are opt-in.
[!WARNING]
The GitHub Releases binaries are unsigned. macOS Gatekeeper and Windows
SmartScreen will show an unknown-publisher warning. Download only from this
repository, verify the included SHA256SUMS, and continue only if you trust
the release. The Microsoft Store build is signed by Microsoft and is not
affected; macOS signing and notarization are planned for a later release.
The wizard configures a reversible user-level background service when the platform supports
one, then prints the dashboard URL (default: http://127.0.0.1:55423). If no supported
service manager is available, it records setup state and prints foreground run guidance. It
uses localhost-first defaults, does not require sudo for the local service, and keeps your
usage history unless you later uninstall with --purge.
For a non-interactive setup from an agent, script, or bundle, run
tokdash setup --auto --json; to preview what setup would change, tokdash setup --dry-run.
To expose the dashboard explicitly on all network interfaces with writes disabled, run
tokdash setup --bind 0.0.0.0; review the remote-access guide first.
Then check the install:
tokdash doctor
doctor checks the runtime, background service, configured port, data paths, and update-check
status. Use tokdash doctor --json for automation.
Update or remove
tokdash update       # upgrade the managed runtime and restart the service when possible
tokdash uninstall    # reverse exactly what setup created; keeps usage history by default
update only drives install methods Tokdash can safely manage. If your runtime was installed
by a package manager Tokdash does not own, it prints the exact manual guidance instead of
mutating that environment.
Existing installs: migration from before v1.0
If you installed Tokdash before the onboarding flow, upgrade first:
Then run tokdash doctor and tokdash setup when you want Tokdash to manage the background
service. If you already have a hand-written systemd or launchd service, setup does not
silently replace it: it refuses unmarked tokdash.service / plist files by default. Keep
managing that service yourself, remove it before setup, or run tokdash setup --force after
checking tokdash setup --dry-run. --force also handles pre-1.0 services that already
occupy port 55423 but do not expose the new /health fingerprint: it rewrites and restarts
the existing tokdash.service. Use tokdash setup --no-service to skip service creation.
If your current setup uses a conda/system/user-pip interpreter and you want tokdash update
to manage future upgrades, migrate the service to Tokdash's setup-owned venv:
# Upgrade the tokdash command you are about to run, for example:
python3 -m pip install --user -U tokdash
# or, for a conda base install:
conda run -n base python -m pip install -U tokdash
tokdash setup --runtime venv --force
tokdash doctor
This keeps your usage history under ~/.tokdash, rewrites the user service to run
~/.tokdash/runtime/python-venv/bin/python -m tokdash, and lets future tokdash update
upgrade that managed venv and restart the service. If you installed with pipx, you can
instead keep the pipx runtime and upgrade with tokdash update or pipx upgrade tokdash.
Foreground fallback
If you only want a one-off foreground process:
tokdash serve
Open http://127.0.0.1:55423. Use tokdash serve --port <port> if the default port is busy.
By default tokdash serve opens the dashboard in your browser once on startup; pass
--no-open to disable it. A bare tokdash with no command just prints the command help
and exits — it no longer starts tokdash serve behind your back.
For full onboarding details — runtime choices, WSL/systemd behavior, macOS launchd,
Tailscale, bundling, update checks, and safe uninstall semantics — see
docs/guides/ONBOARDING.md. For remote access through
Tailscale Serve, SSH forwarding, or an explicit network bind, see
docs/guides/REMOTE_ACCESS.md.
Contribution calendar: 2D heatmap + 3D isometric view with Tokens/Cost/Messages metrics
Report tab: a week / month / year-to-date report of your own agent activity, with a shareable card for each tier of detail. Every export writes a light and a dark PNG
Quota tab: subscription window bars with reset countdowns for nine providers. Codex windows work out of the box from local logs; most other sources need opt-in live polling
Terminal dashboard[new]: tokdash tui — Overview, Report and Quota in the terminal, no browser required
Companion status bar app: spend and subscription quota from the macOS menu bar or Windows notification area — on the Microsoft Store for Windows
Statusline integration: a live token-usage indicator inside Claude Code's statusline (or any agent that can hit a local HTTP endpoint)
Multi-server views: add WSL, macOS, and other Tokdash servers in Settings; combine usage across any selection while keeping quota grouped by machine. See remote access.
Themes and app polish: 17 style themes, light/dark mode, PWA install support, UI in six languages
Supported clients
Tokdash reads the local session logs of 27 supported agents — the pill row
above names them; the full matrix (usage & cost / Session Explorer coverage,
per-client data paths, overrides, and source-specific accounting notes) is in
Supported clients.
Quota tracking (optional)
The Quota tab shows subscription utilization windows and reset countdowns for
nine providers. Codex's 5-hour/weekly windows work out of the box from local
logs (treat them as an estimate); accurate Codex consumption and every other
provider — Claude Code, Antigravity, MiniMax, Kimi Code, Grok, Z.ai, OpenCode
Go, Command Code — come from opt-in live polling: Tokdash calls each
provider's own quota endpoint with the sign-in your CLI already has. Off by
default, per-provider consent, results kept in the local database.
The consent commands, master switch, poll cadence, and per-provider credential
notes are in docs/reference/QUOTA.md.
Cost Accuracy Note
Token counts depend on what each client logs locally. Costs are computed from the bundled pricing database (src/tokdash/pricing_db.json) by default, or from your saved dashboard pricing override at <data_dir>/pricing_db.json when present. Either way they may lag real provider pricing — use as an estimate and verify against your billing source if it matters.
History retention
[!IMPORTANT]
Keep your history. Claude Code and Gemini CLI delete local sessions older than ~30 days by default, so Tokdash's earlier months can silently shrink.
Tokdash reads each client's local session logs; the local SQLite index cannot
recover logs deleted before they were indexed. Only two supported clients delete
old sessions by default, and both are a one-line fix:
Claude Code: add { "cleanupPeriodDays": 3650 } to ~/.claude/settings.json (and any alternate CLAUDE_CONFIG_DIR).
Gemini CLI: set { "general": { "sessionRetention": { "enabled": false } } } in ~/.gemini/settings.json (workspace settings override user settings).
Every other supported client keeps history indefinitely by default. For the full
per-client survey, fix details, and what the local SQLite index does and does not
preserve, see docs/reference/HISTORY_RETENTION.md.
Roadmap
See docs/development/ROADMAP.md.
Contributing / security
Contributing guide: docs/CONTRIBUTING.md
Security policy: docs/SECURITY.md
Documentation
Full documentation lives in docs/ (start at the index), grouped into: