
其他
完整应用

deepseek-harness
deepseek-ai
DeepSeek Harness: Everything is a Plugin.
PROJECT TOPICS
INSTALL REFERENCE
dsh plugin --profile web add github:HellowVirgil/dsh-antv-ava
该命令指向仓库当前默认分支;尚无绑定当前 commit 的完整验证结果。
PROJECT README
🌐 简体中文 | English
Let DeepSeek Harness automatically present data-heavy answers as streaming narrative text, AntV charts, or a natural combination of both.








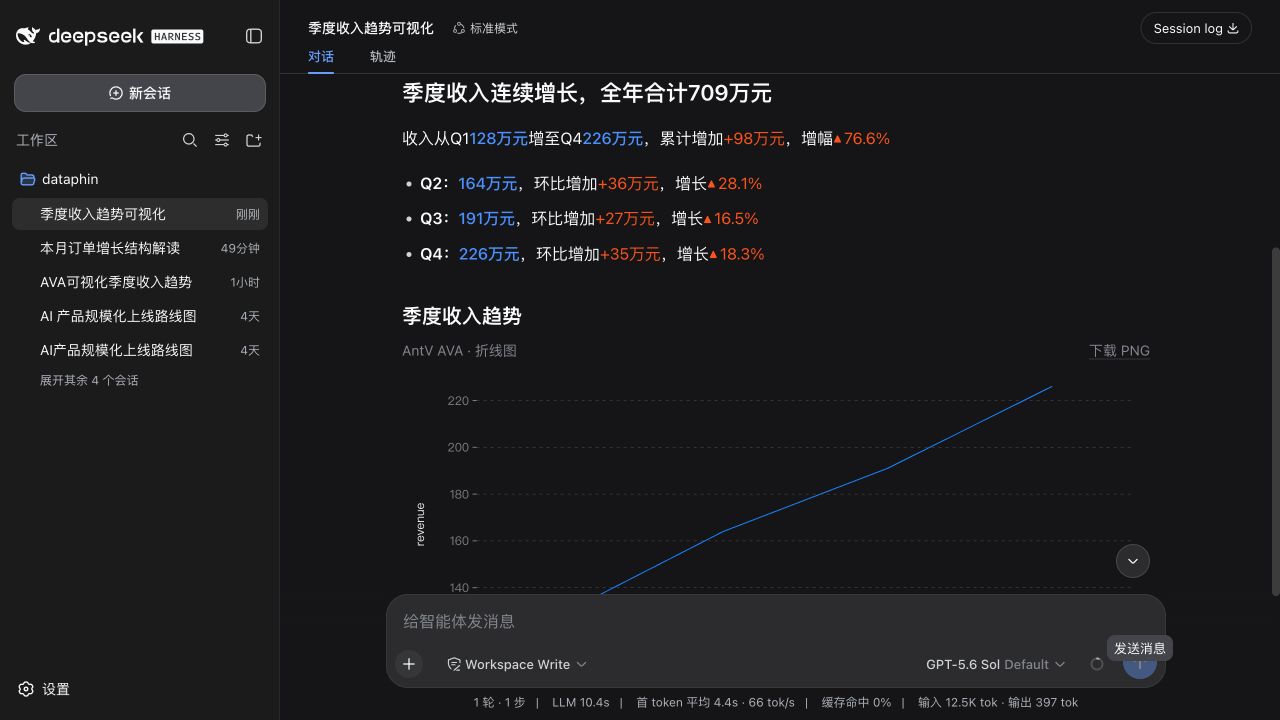
Narrative text and charts flow directly with the model reply instead of appearing in separate cards. Text renders phrase by phrase, while GPT-Vis charts appear as soon as usable data arrives and keep updating during generation.
dsh plugin --profile web add dsh-antv-avaRestart dsh web and reload the page after installation. The plugin injects the required output contract automatically, so regular users do not need to install a separate Skill or write DSL by hand.
Ask naturally after installation.
Interpret the following business data and provide concise, easy-to-scan conclusions:
Total orders reached 198M this month, up 7.05% year over year…
The model will usually return streaming NTV with emphasized metrics, changes, shares, and category conclusions.
Analyze the revenue change from Q1 to Q4 and choose an appropriate visualization:
Q1 1.28M, Q2 1.64M, Q3 1.91M, Q4 2.26M.
When visual shape makes a trend or comparison easier to understand, the model combines narrative text with a chart.
Plot the following data as a trend chart. Return only the chart: …When explicitly requested, the model can return a chart without repeating the same information as narrative text.
| Content | Typical result |
|---|---|
| KPIs, period-over-period changes, shares, category breakdowns, and conclusions | NTV |
| Trends, comparisons, distributions, rankings, or compositions benefit from shape | NTV + Chart |
| The user explicitly requests only a chart, or narrative adds no value | Chart |
This selection is automatic; users do not need to understand the internal format.
NTV supports:
Charts use GPT-Vis syntax and support:
The plugin works on its own. Install the bundled Skill only when the agent environment discovers ~/.agents/skills and complex data tasks need stricter guidance for fact preservation and presentation selection.
mkdir -p ~/.agents/skills/antv-ava
cp SKILL.md ~/.agents/skills/antv-ava/SKILL.mdThe model can emit narrative, chart, or both inside one ava fence:
```ava
ava
language en-US
narrative
  headline Quarterly revenue continued to grow
  paragraph
    text Q4 revenue reached
    metric-value 2.26M
    text , up from Q1 by
    ratio positive 76.6%
chart
  vis line
  data
    - time Q1
      value 1.28
    - time Q4
      value 2.26
  title "Quarterly revenue trend"
  axisXTitle Quarter
  axisYTitle "Revenue (M)"
```Use the plugin for evidence-backed KPIs, business analysis, trends, shares, rankings, and category breakdowns. It does not invent values for visualization and never executes arbitrary HTML, SVG, or scripts emitted by the model.
Processes, hierarchies, and roadmaps without meaningful numeric structure are better suited to an infographic plugin.
git clone https://github.com/HellowVirgil/dsh-antv-ava.git
cd dsh-antv-ava
pnpm install
pnpm run check
dsh plugin --profile web add "link:$PWD"pnpm test
pnpm build
pnpm run verify:packMIT. AntV AVA and AntV GPT-Vis are also licensed under MIT.
CLASSIFICATION EVIDENCE
系统优先读取 GitHub Topics,再与站内分类词典和词根规则比对。当前命中: 无有效分类标签。
deepseek-ai
DeepSeek Harness: Everything is a Plugin.

anywhere-labs
为 DeepSeek Harness (DSH) 插件生态打造的现代化桌面端解决方案。万物皆「插件」,桌面本身也是「插件」。

awesome-dsh-plugin
A curated list of plugins for DeepSeek Harness (dsh) · DeepSeek Harness 插件精选列表