
其他
完整应用

deepseek-harness
deepseek-ai
DeepSeek Harness: Everything is a Plugin.
PROJECT TOPICS
INSTALL REFERENCE
dsh plugin --profile web add github:1841220388zzzcccxxx-star/dsh-token-stats
该命令指向仓库当前默认分支;尚无绑定当前 commit 的完整验证结果。
PROJECT README
Token usage & cost statistics plugin for DeepSeek Harness (DSH).
Tracks token consumption per model, per date, and per session with cost estimation in USD / CNY, served as a native page under Settings → 📊 Token Stats. Installed as an external DSH plugin, it loads automatically at DSH startup — no manual activation needed.
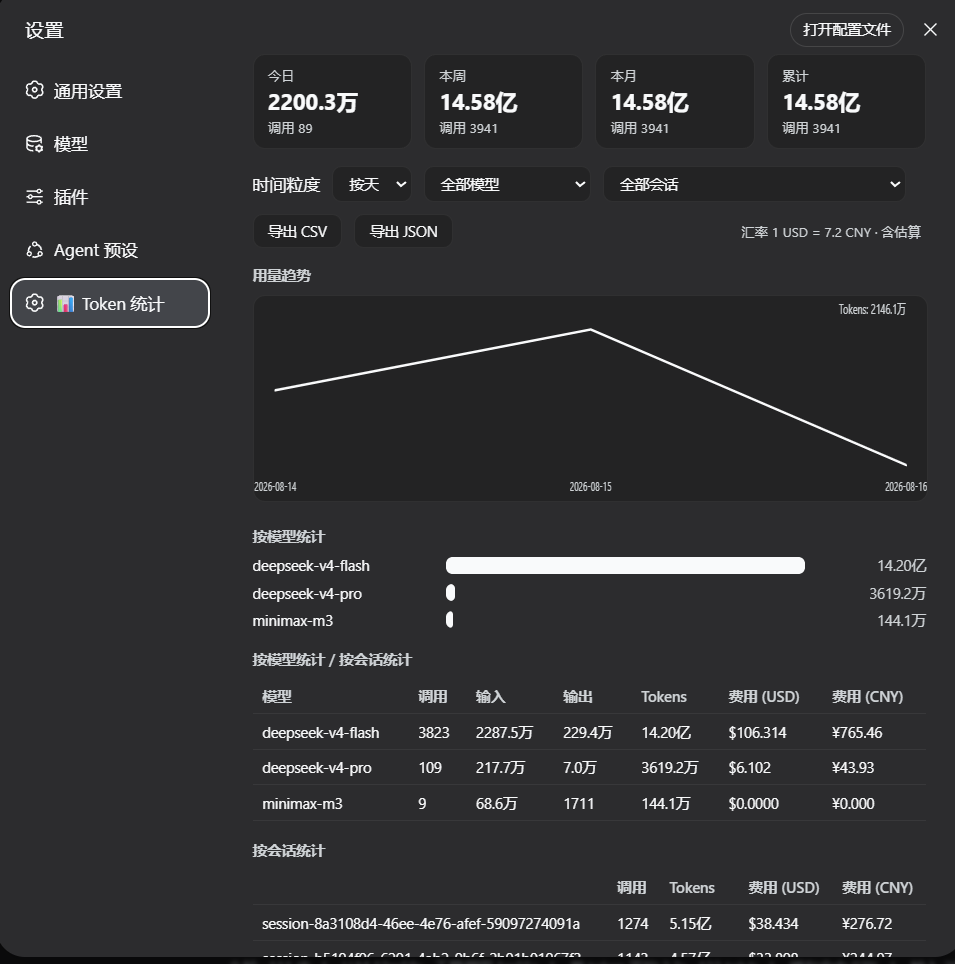
The plugin is installed as an external DSH profile dependency.
Clone this repository to a local folder, e.g. D:\dev\dsh-token-stats
In your DSH profile manifest (~/.dsh/profiles/web/package.json):
{
  "dependencies": {
    "dsh-token-stats": "link:D:/dev/dsh-token-stats"
  },
  "dsh": {
    "profile": {
      "bundles": ["@deepseek-ai/dsh-base", "@deepseek-ai/dsh-web-app", "dsh-token-stats"]
    }
  }
}
cd ~/.dsh/profiles/web && pnpm install
Restart DSH web. Open Settings → 📊 Token Stats.
cordis.patch.ymldeclares the bundle-layer mount point so the plugin auto-loads at startup. With alink:dependency the profile mounts the source folder directly — after editing the plugin, just restart DSH web (no copy step).file:also works but needs a re-copy per change (.\sync-deploy.ps1automates that). Alternatively,dsh plugin --profile web add link:<path>forwards the install to pnpm; thedsh.profile.bundlesentry still needs adding by hand.
Declared per the official plugin contract and enforced by DSH ≥ 0.2.0 at install/startup preflight:
engines.dsh / peerDependencies["@deepseek-ai/dsh"]: >=0.1.0-rc.6 <0.3.0sessionQuery, tokenMeter.estimateMessage, session/event, llm/stream,
webServer.register) and the settings.section client slot are all present in both lines.DSH is developer preview and iterating rapidly. If the runtime version falls outside the declared range, DSH rejects the plugin at startup — update the range only after re-testing, or grant an exact-version exemption with
dsh plugin allow-version.
assistant/message events carry real usage
(input / output / cache-read / cache-write / reasoning tokens), request/header events carry provider/model.sessionQuery) rebuilds the in-memory aggregation index from all history
(bounded concurrency).llm/stream usage chunks are captured for live (display-only) in-flight totals.tokenMeter.estimateMessage is used and the record is flagged estimated./token-stats/api)| op | description |
|---|---|
summary |
today / week / month / total aggregates |
query |
time series (day/week/month) + per-model / per-session aggregates; filters: model, sessionId, from, to |
models |
built-in pricing table (USD per 1M tokens) + USD→CNY rate |
sessions |
session list (id + title) |
export |
CSV / JSON dump (format=csv\|json, optional model / sessionId) |
node --check index.js      # server half
node --check client.js     # browser half
node test-plugin.js        # standalone mock tests: correctness + performance benchmarks
.\sync-deploy.ps1 # only needed for file: installs; link: mounts restart to reloadMeasured on the author's machine (14 sessions / ~10k records):
| endpoint | before | after |
|---|---|---|
sessions |
~1700 ms (N serial readTitle calls) |
~12 ms (one batched readTitleSnapshots + cache) |
summary |
~110 ms (4× full-array filters) | <1 ms (single pass) |
query |
~10 ms | ~18 ms at 10k records (memoized cost) |
MIT © 2026 quansheng
CLASSIFICATION EVIDENCE
系统优先读取 GitHub Topics,再与站内分类词典和词根规则比对。当前命中: 无有效分类标签。
deepseek-ai
DeepSeek Harness: Everything is a Plugin.

anywhere-labs
为 DeepSeek Harness (DSH) 插件生态打造的现代化桌面端解决方案。万物皆「插件」,桌面本身也是「插件」。

walkinglabs
Harness engineering beginner tutorial, from 0 to 1